Kervax

Open source · AGPL-3.0 · self-hosted

Enterprise-grade monitoring, out of the box

Sites, servers, containers, databases and backups — in one panel. The install runs as a single command: the agent detects what runs on each machine, dashboards fill in from the first check, and alerts go to Telegram or a webhook.

Docker Compose 2 GB of RAM is enough Linux agent Telegram and webhook EN / RU
kervax.example.comenlarge
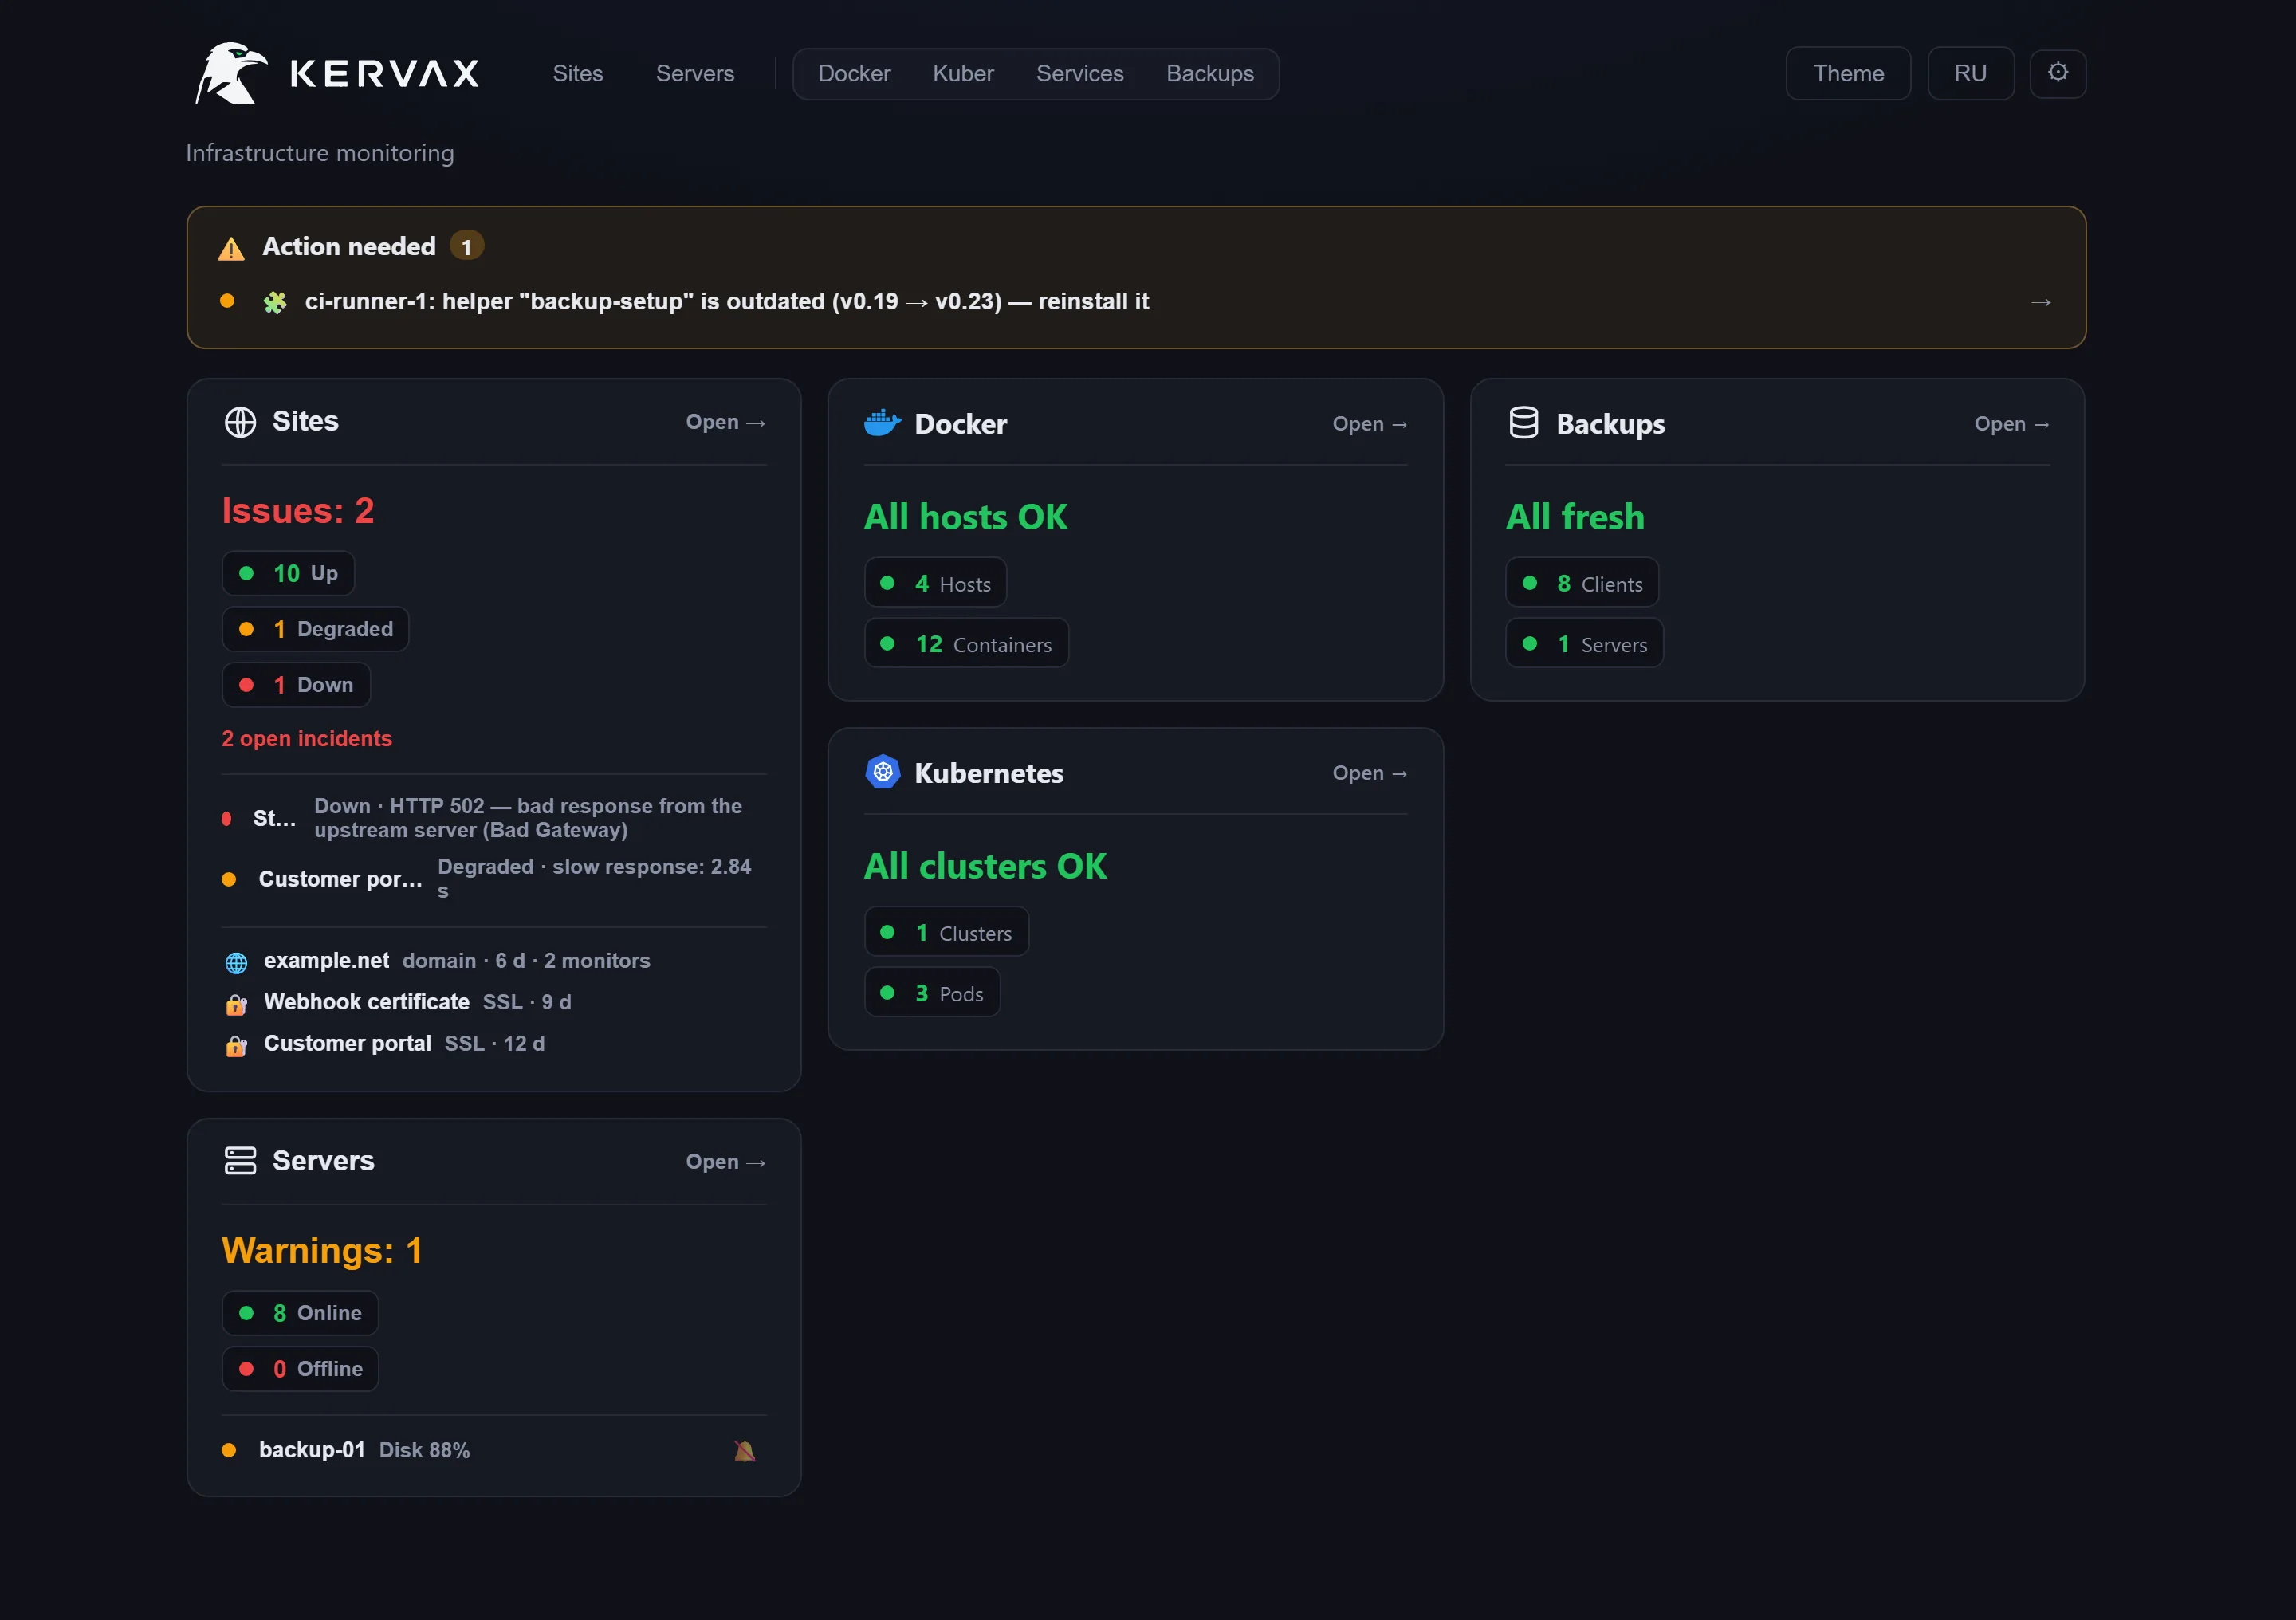
Kervax home screen

Features

All infrastructure on one screen

External checks, host metrics and backup state usually live in separate systems. Here they share one database and one timeline: a failing monitor and the machine behind it are two clicks apart.

Sites

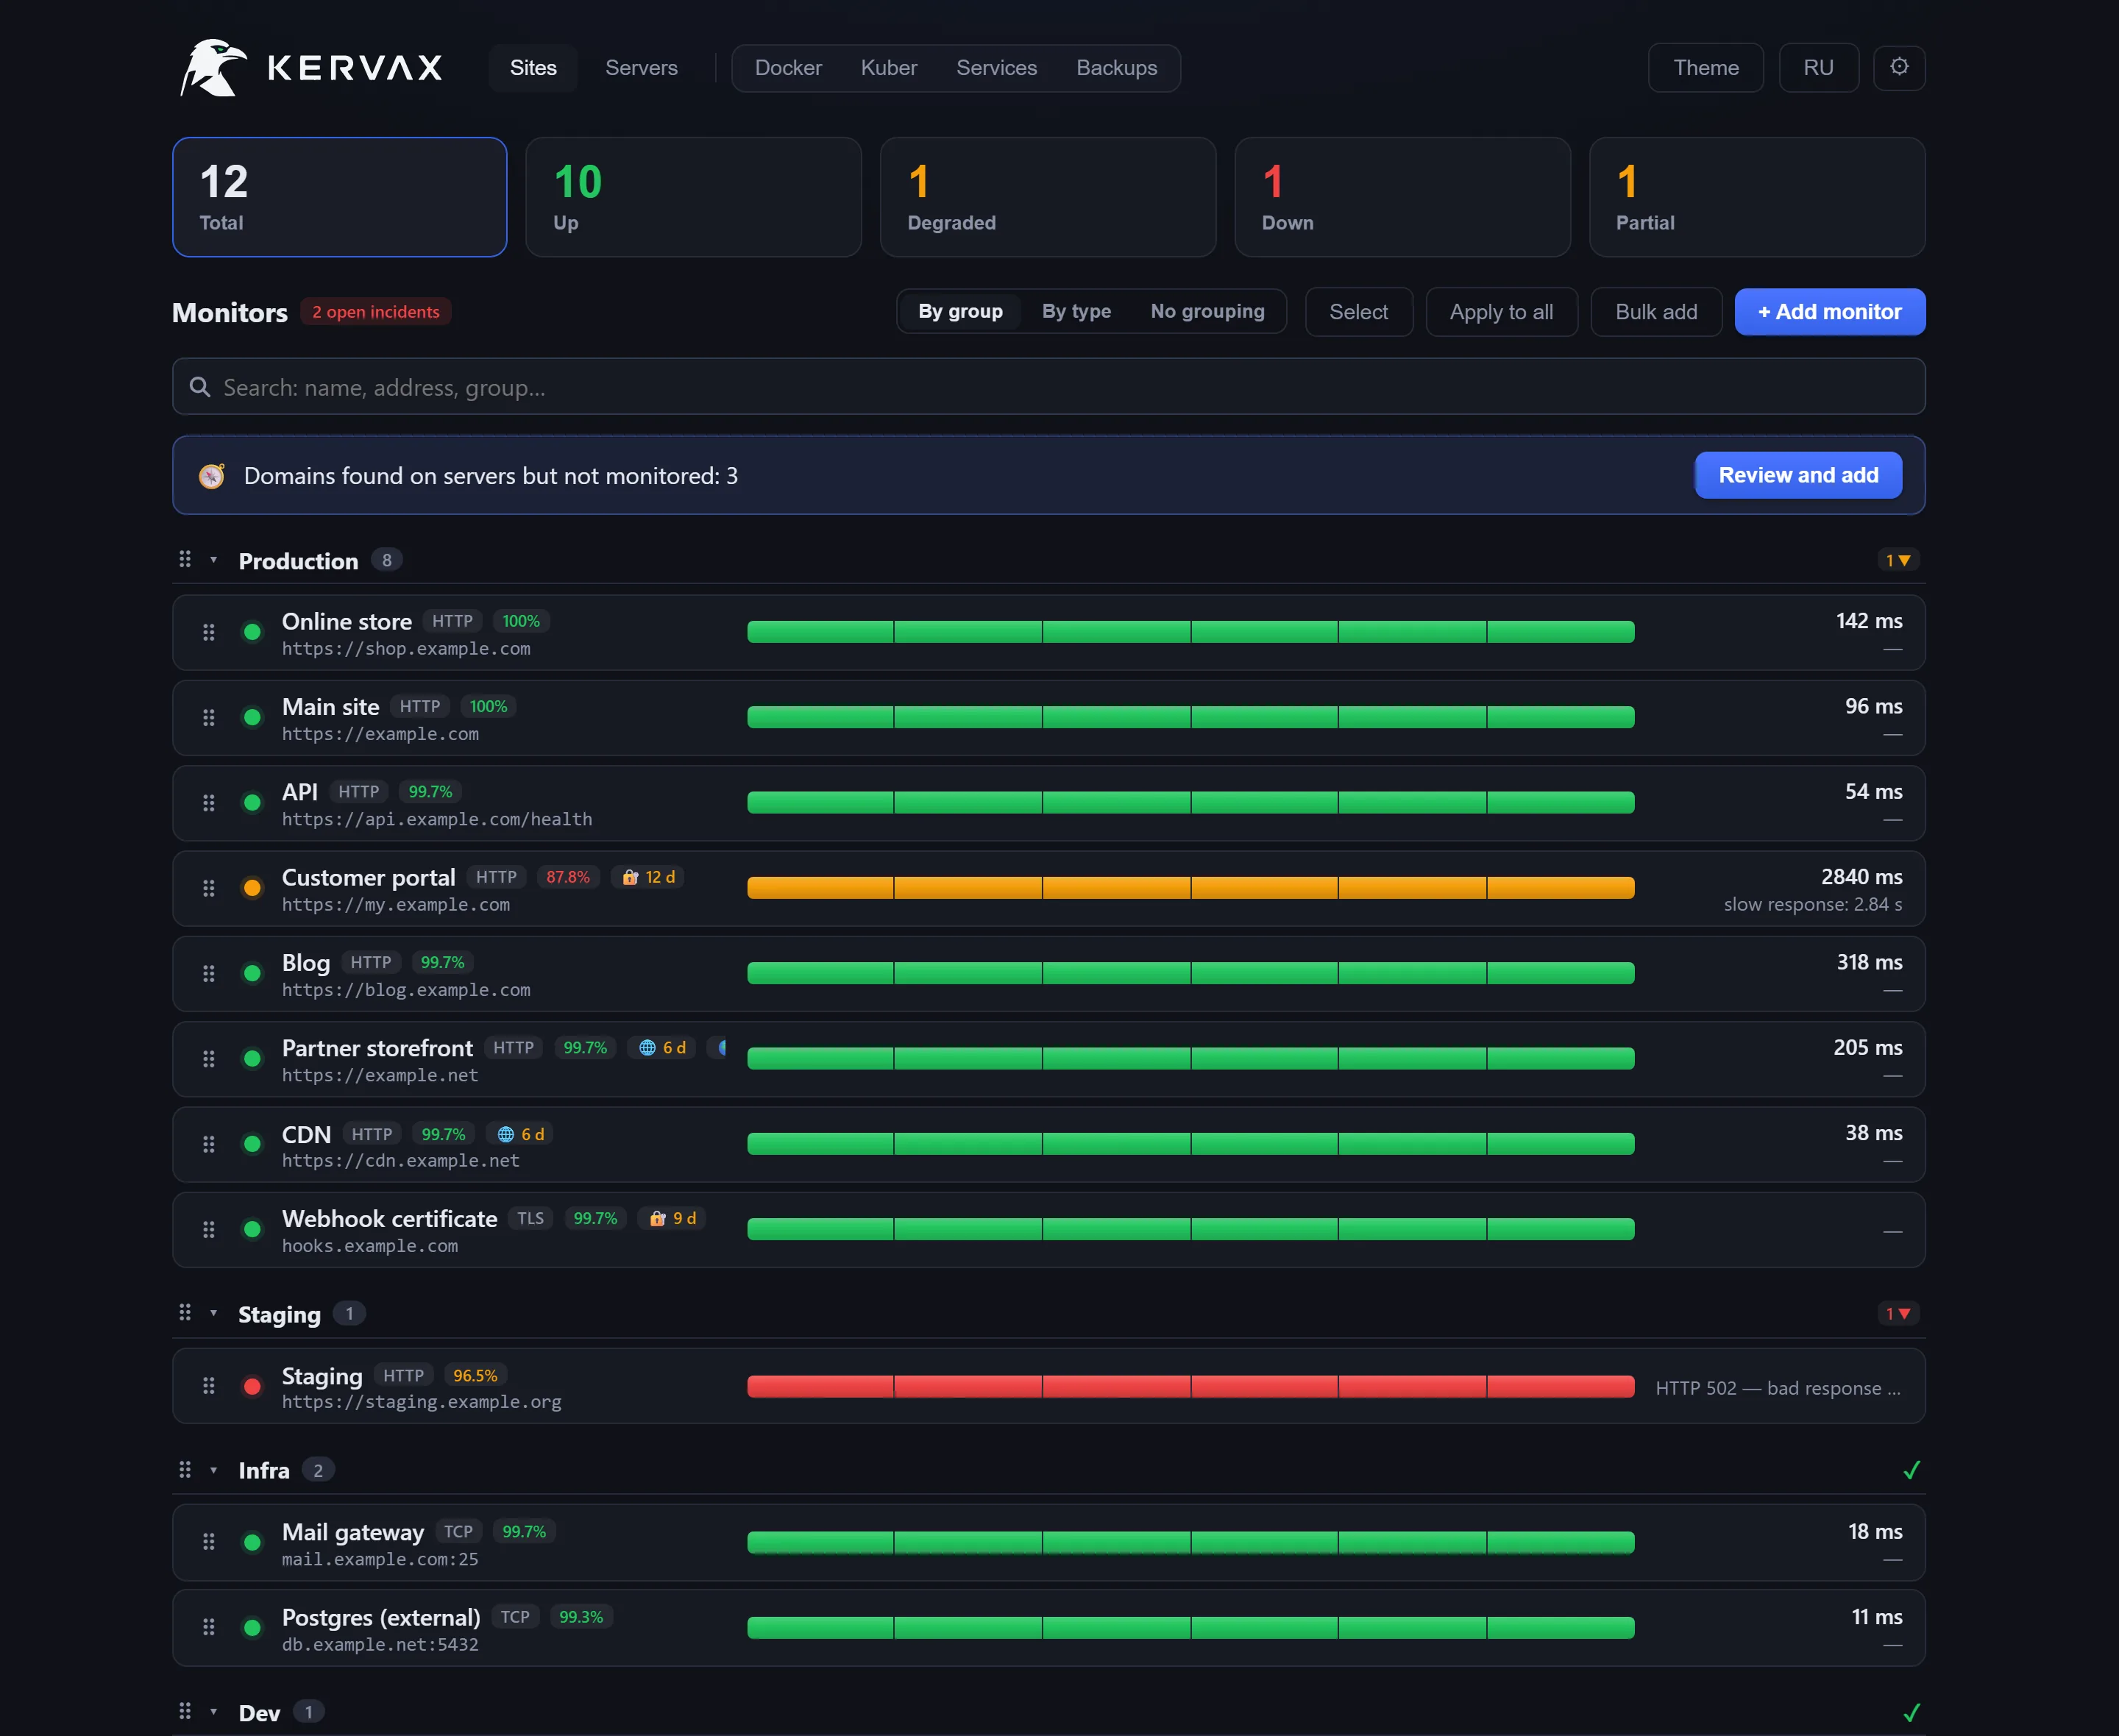
Response code, a keyword in the body, response time, TLS certificate and domain expiry. Sites are additionally checked through proxies in other networks: if a site answers you but not them, the panel reports that as a separate state rather than a plain "up".

Servers

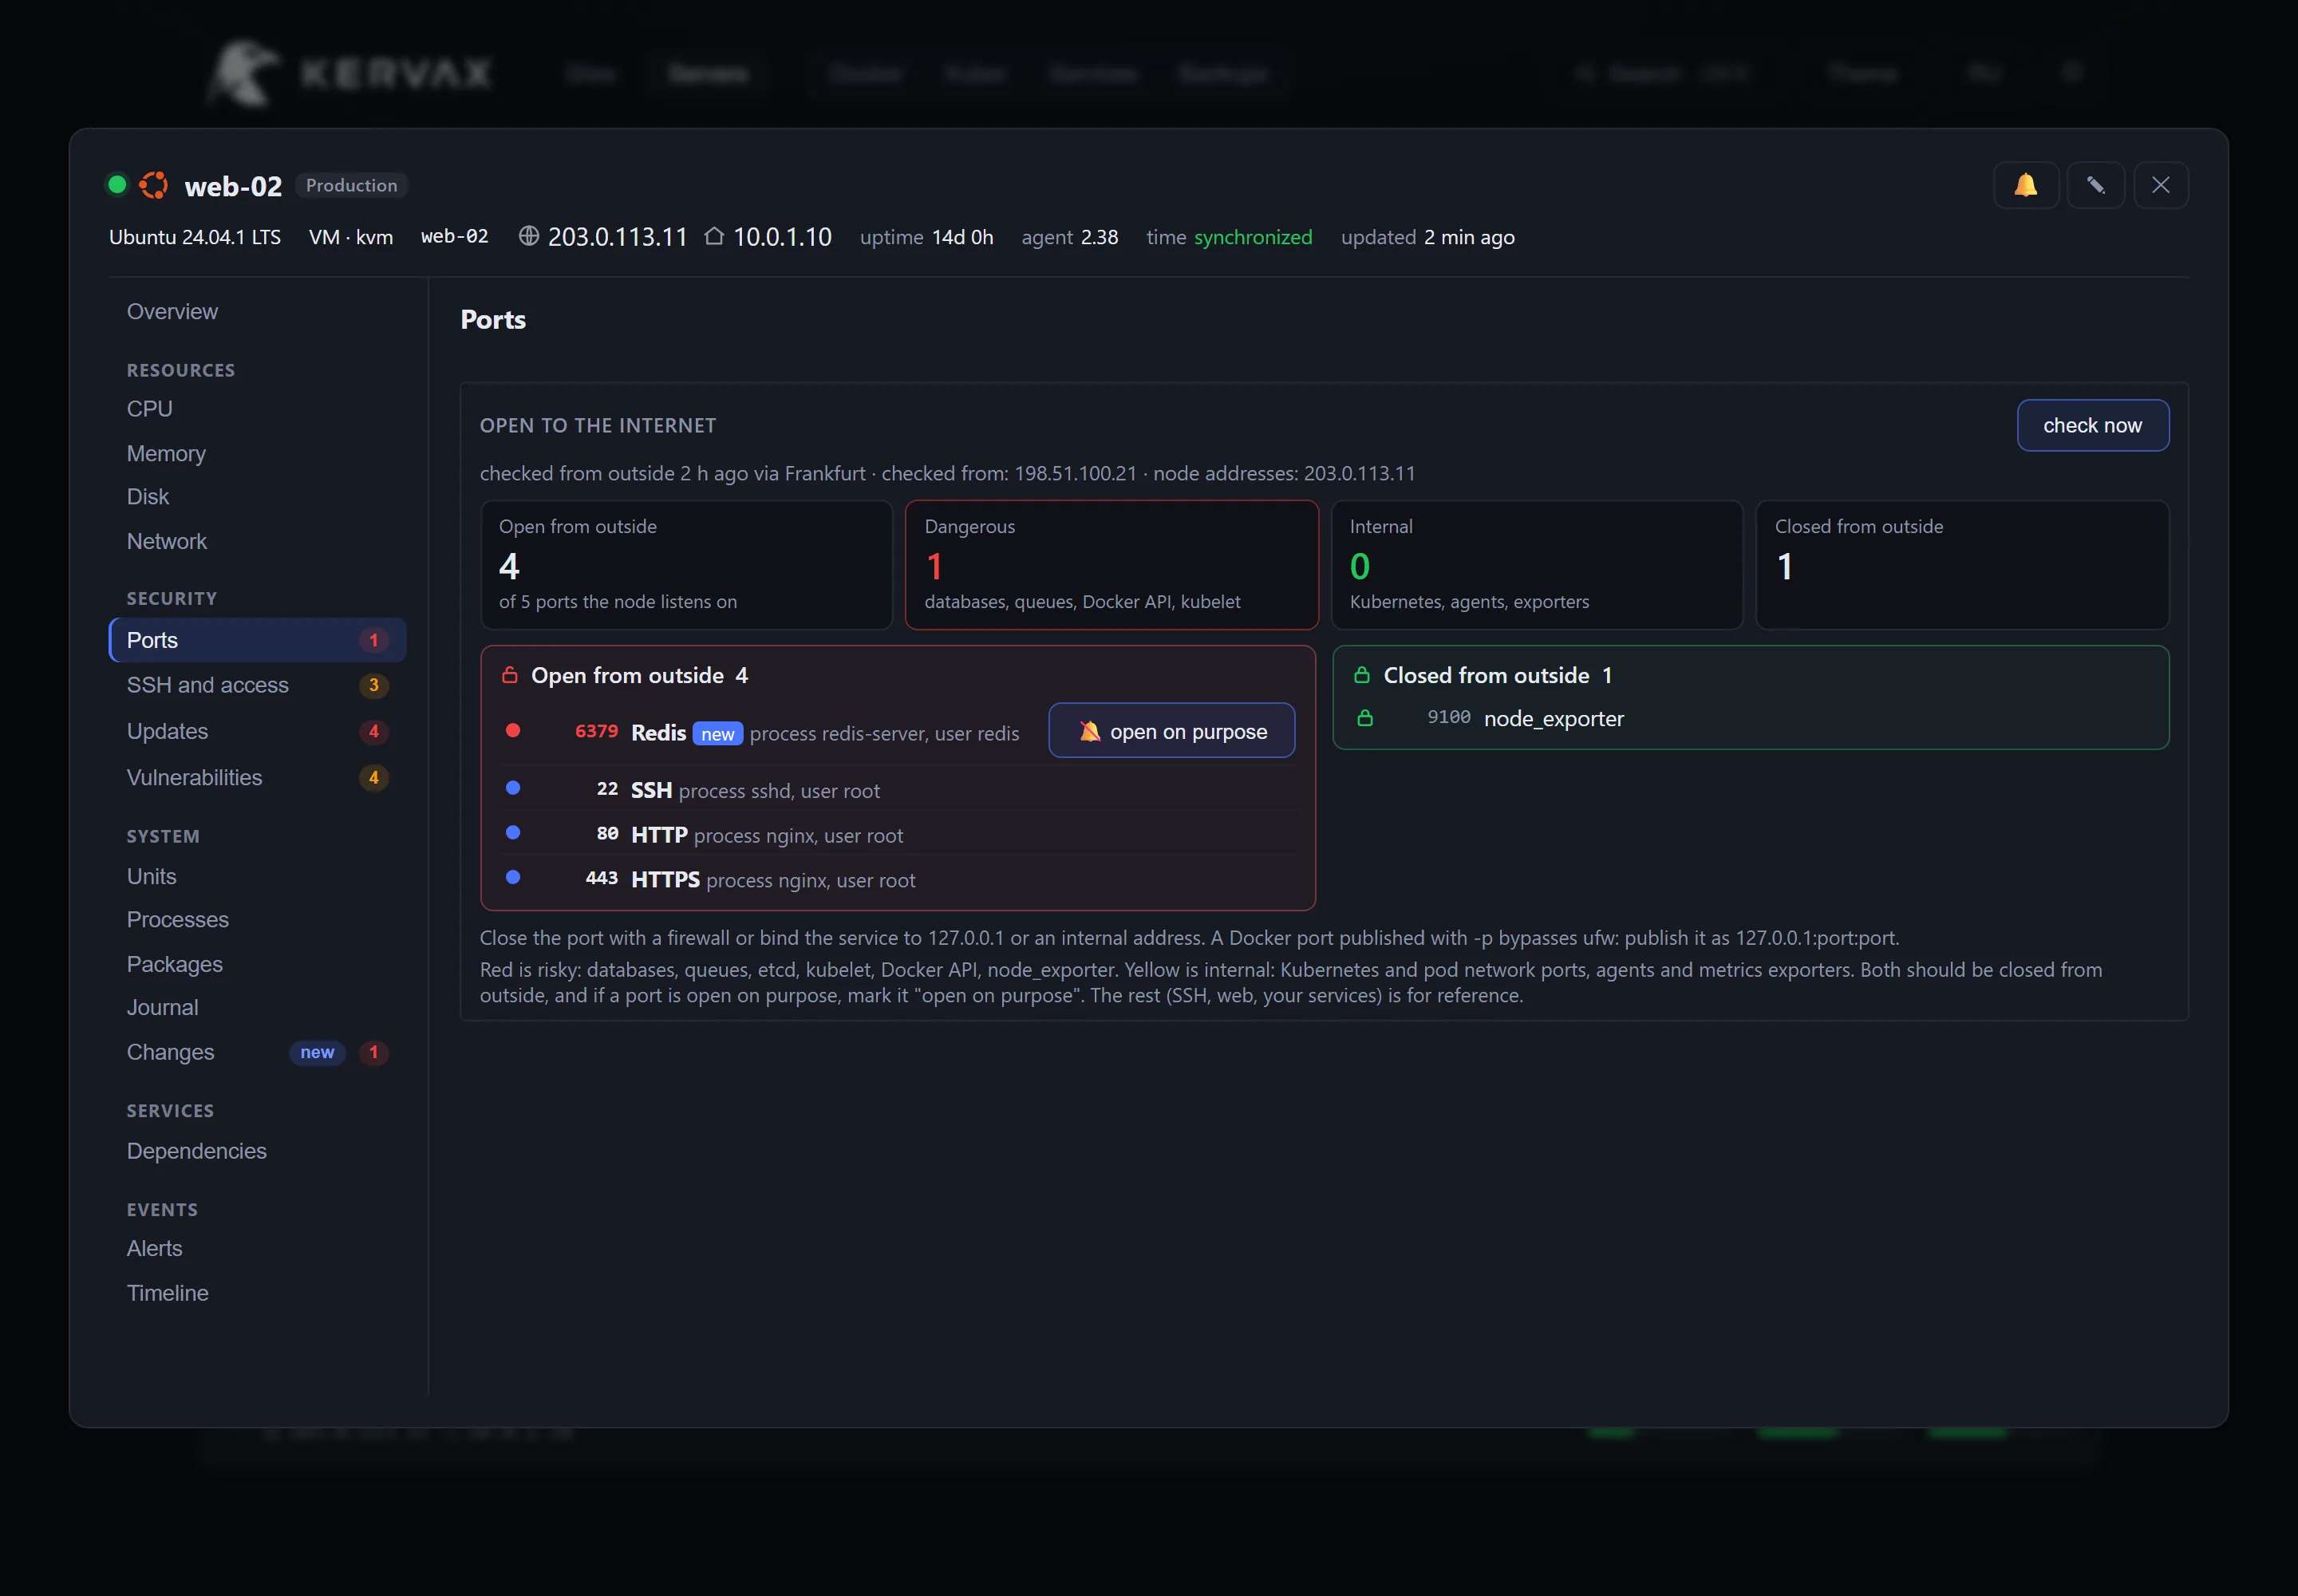
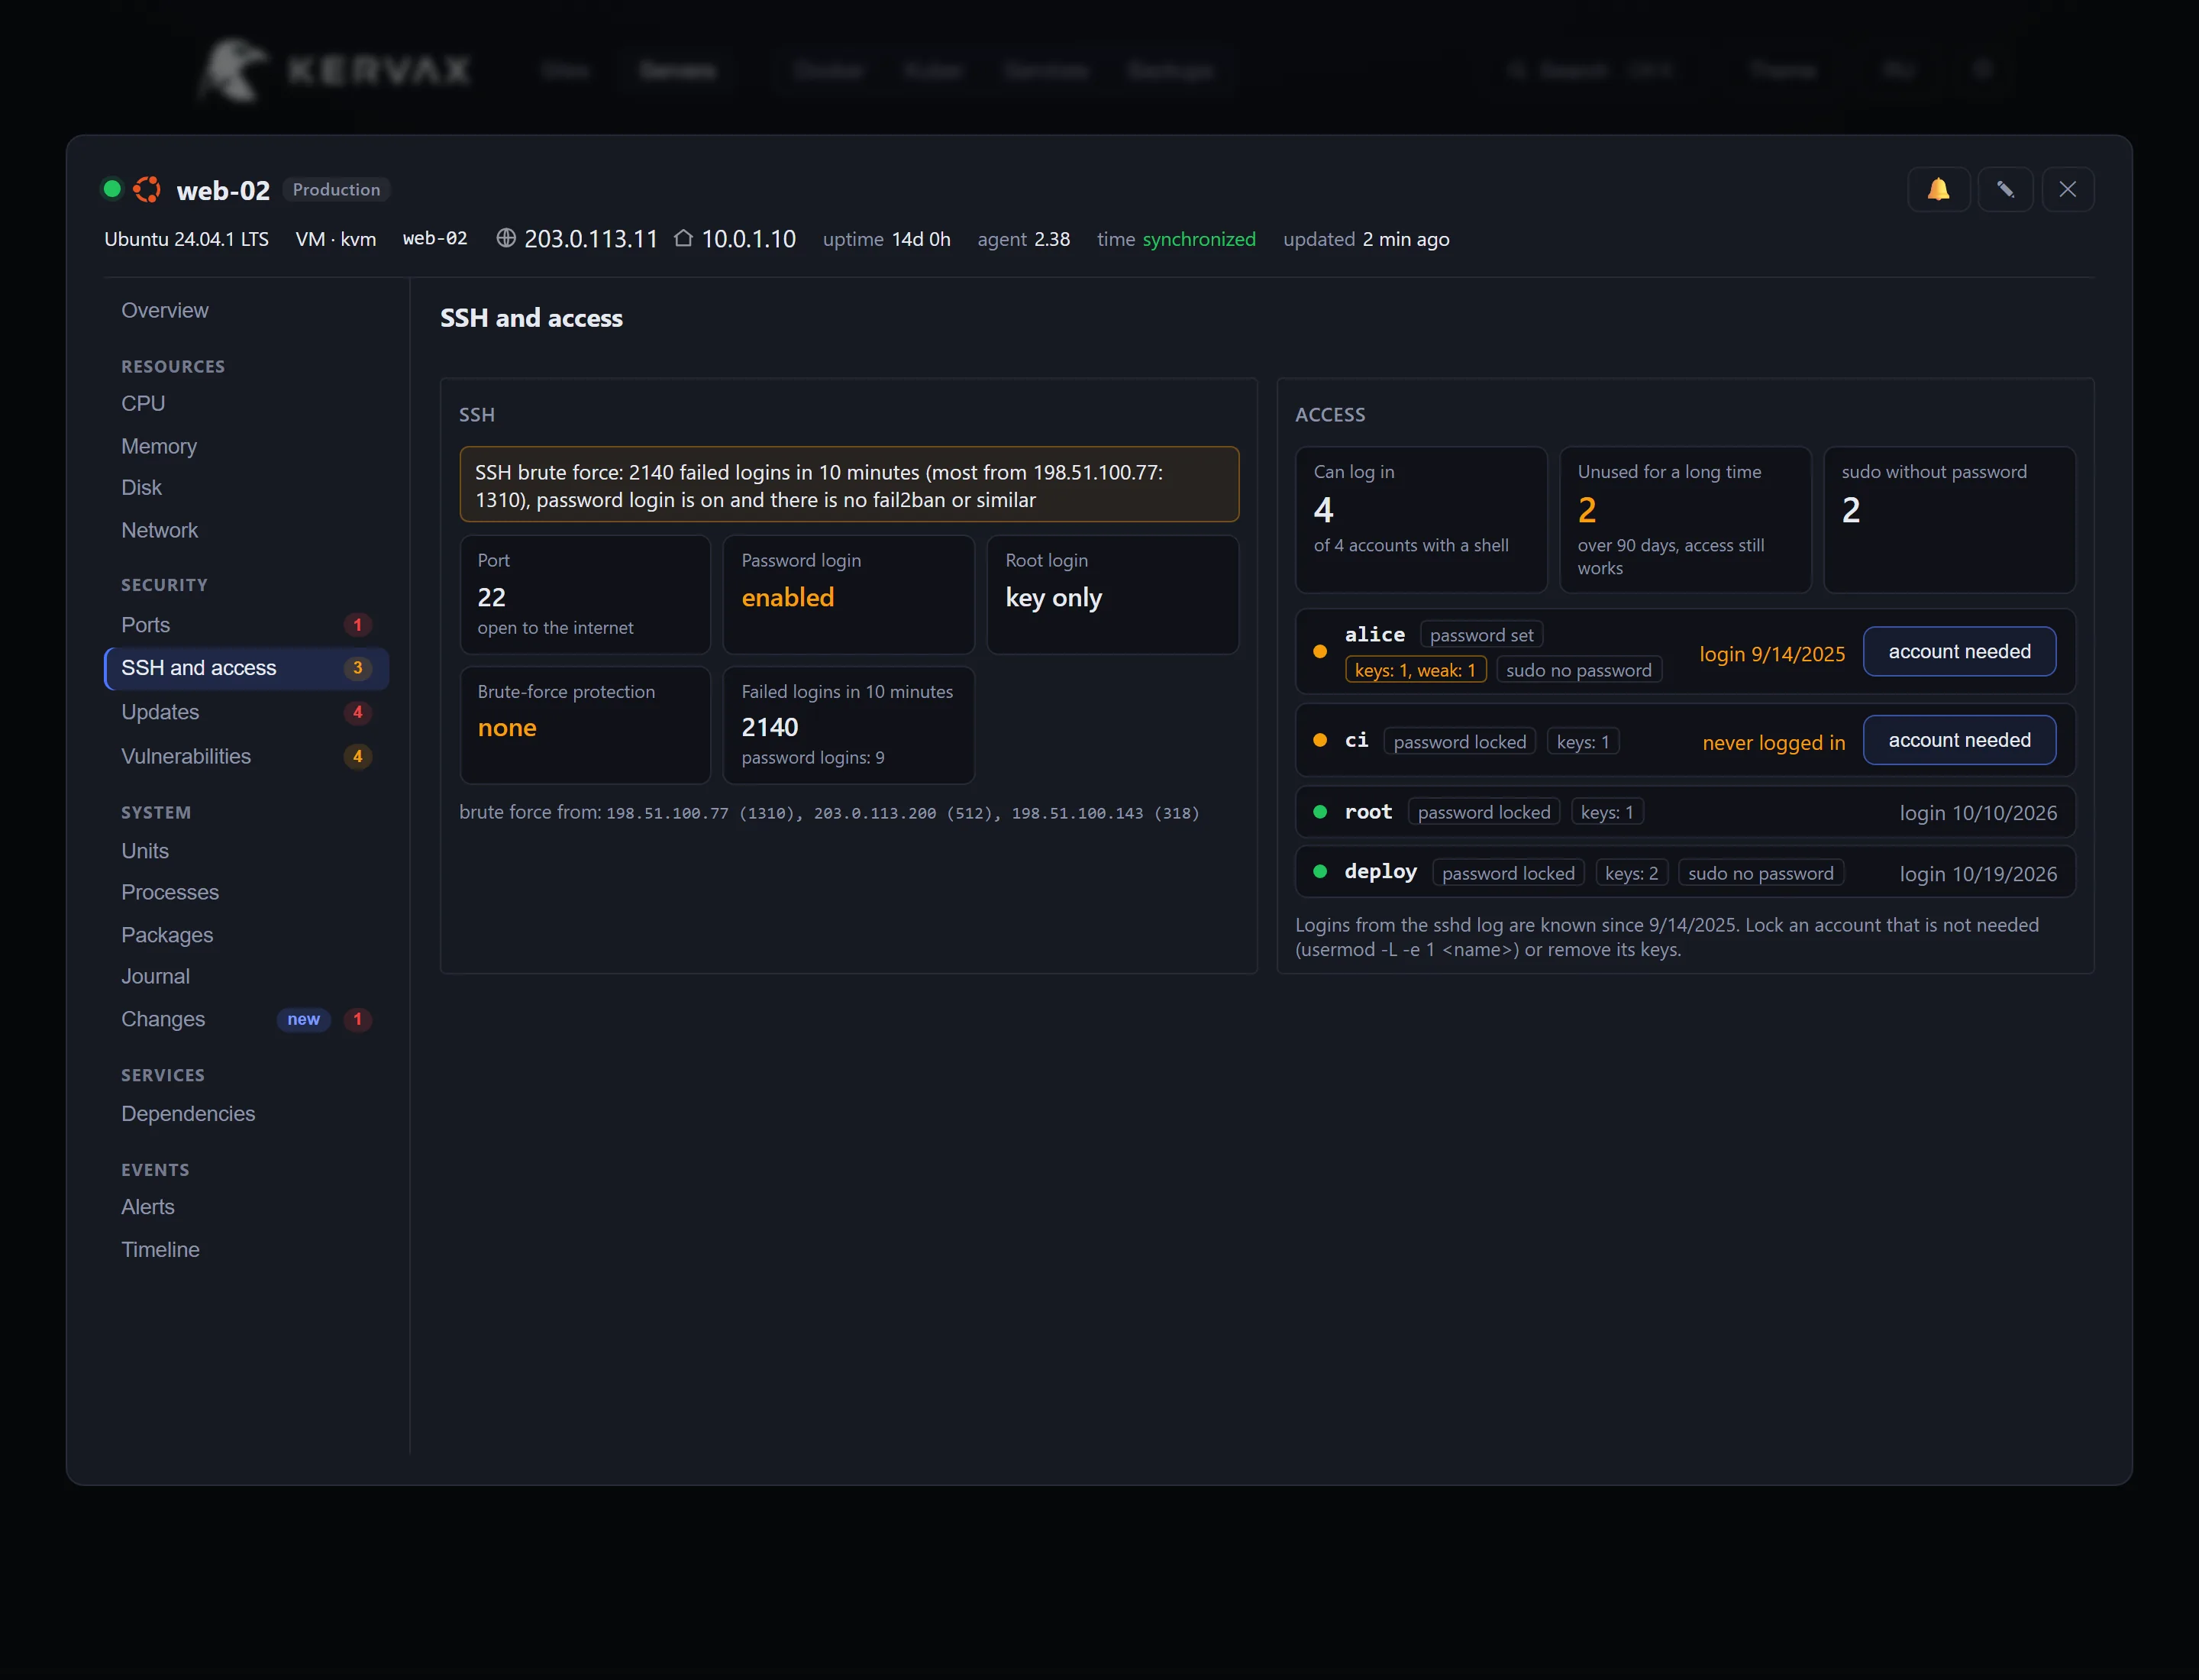
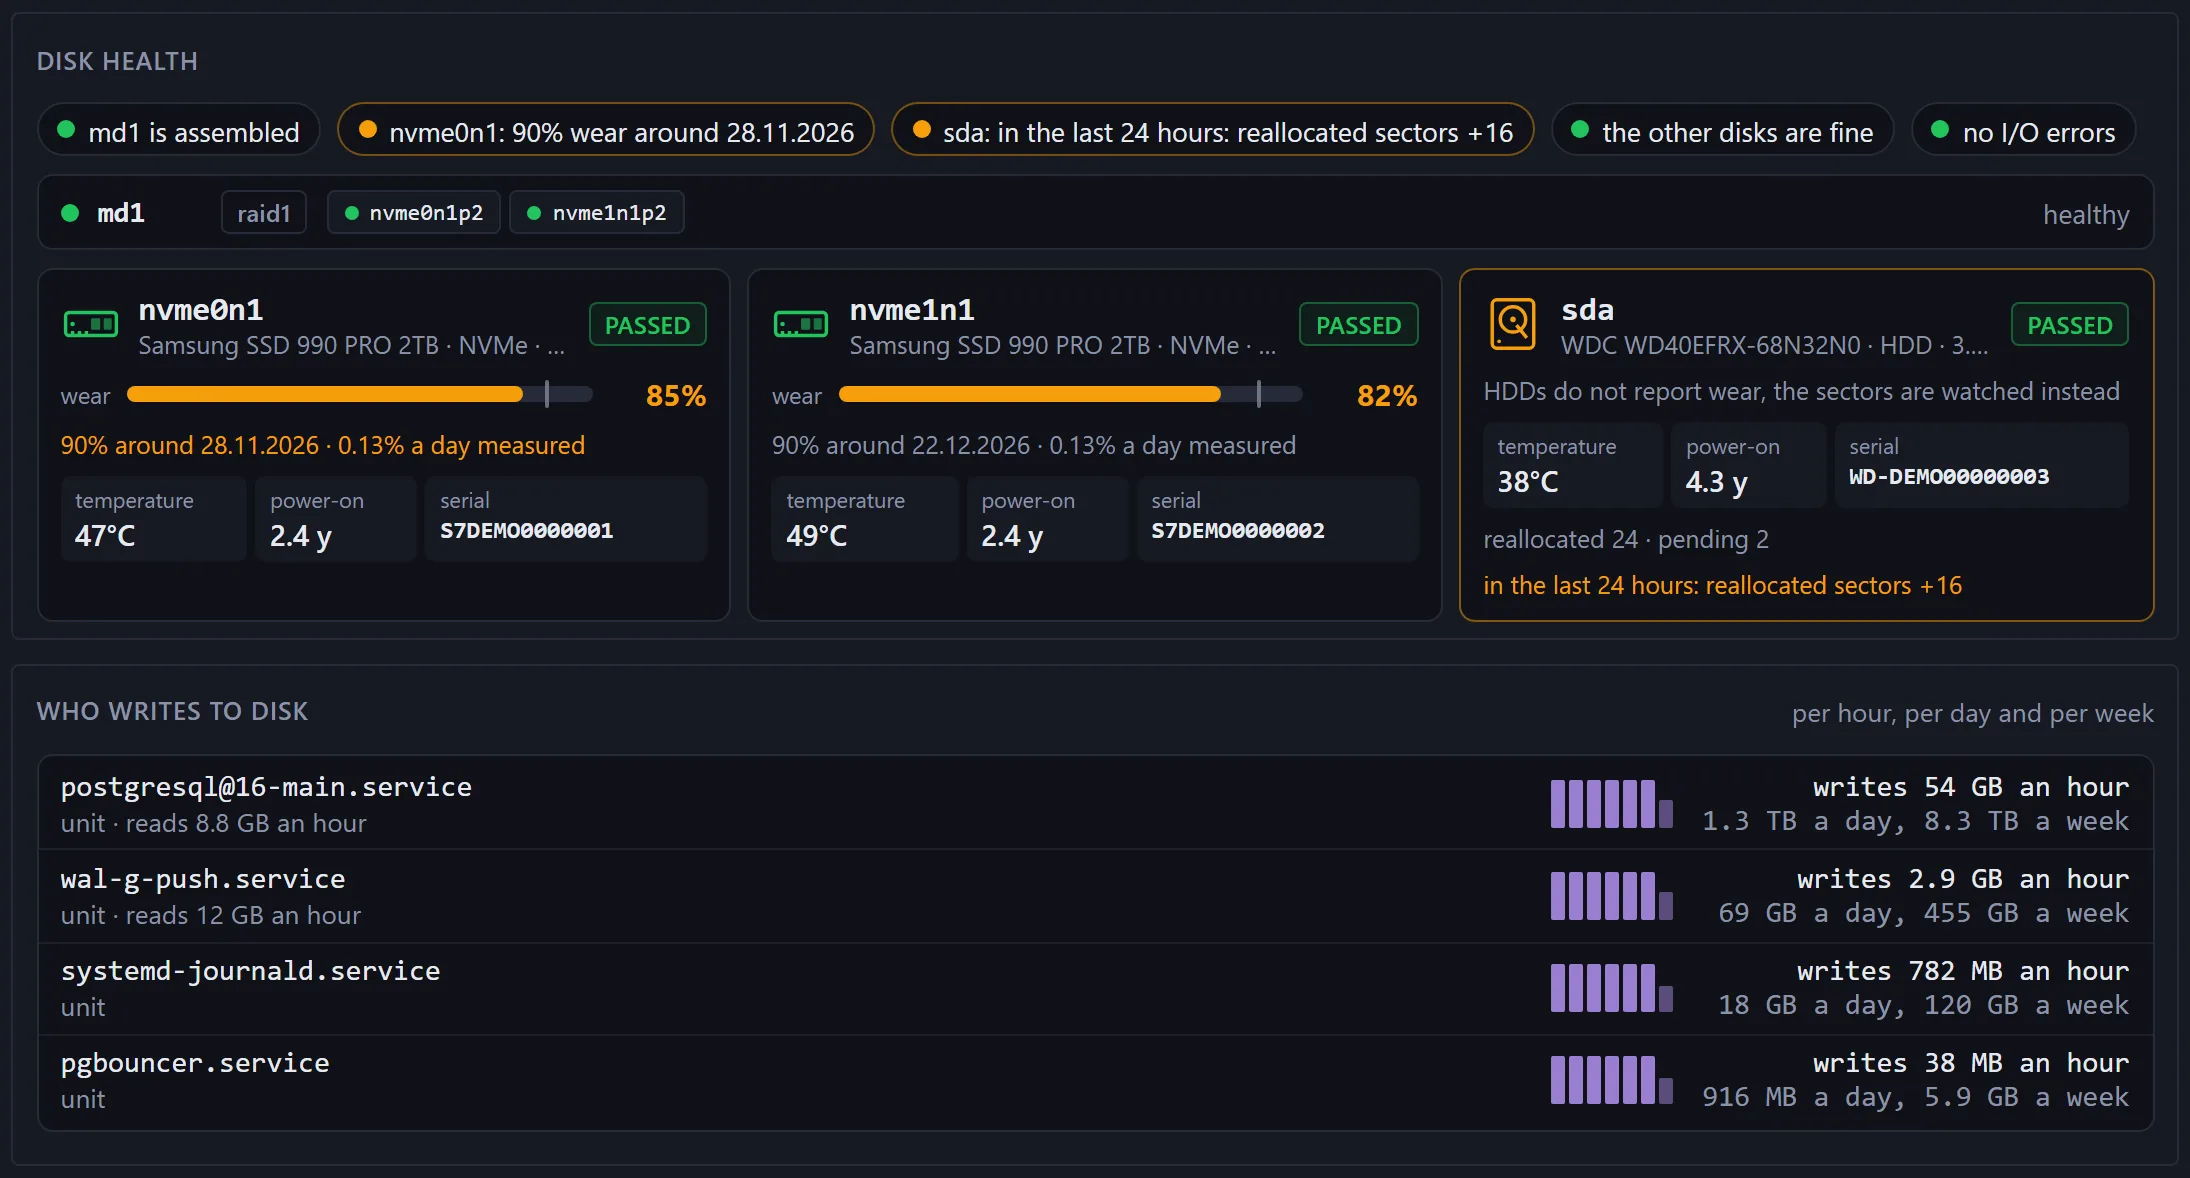
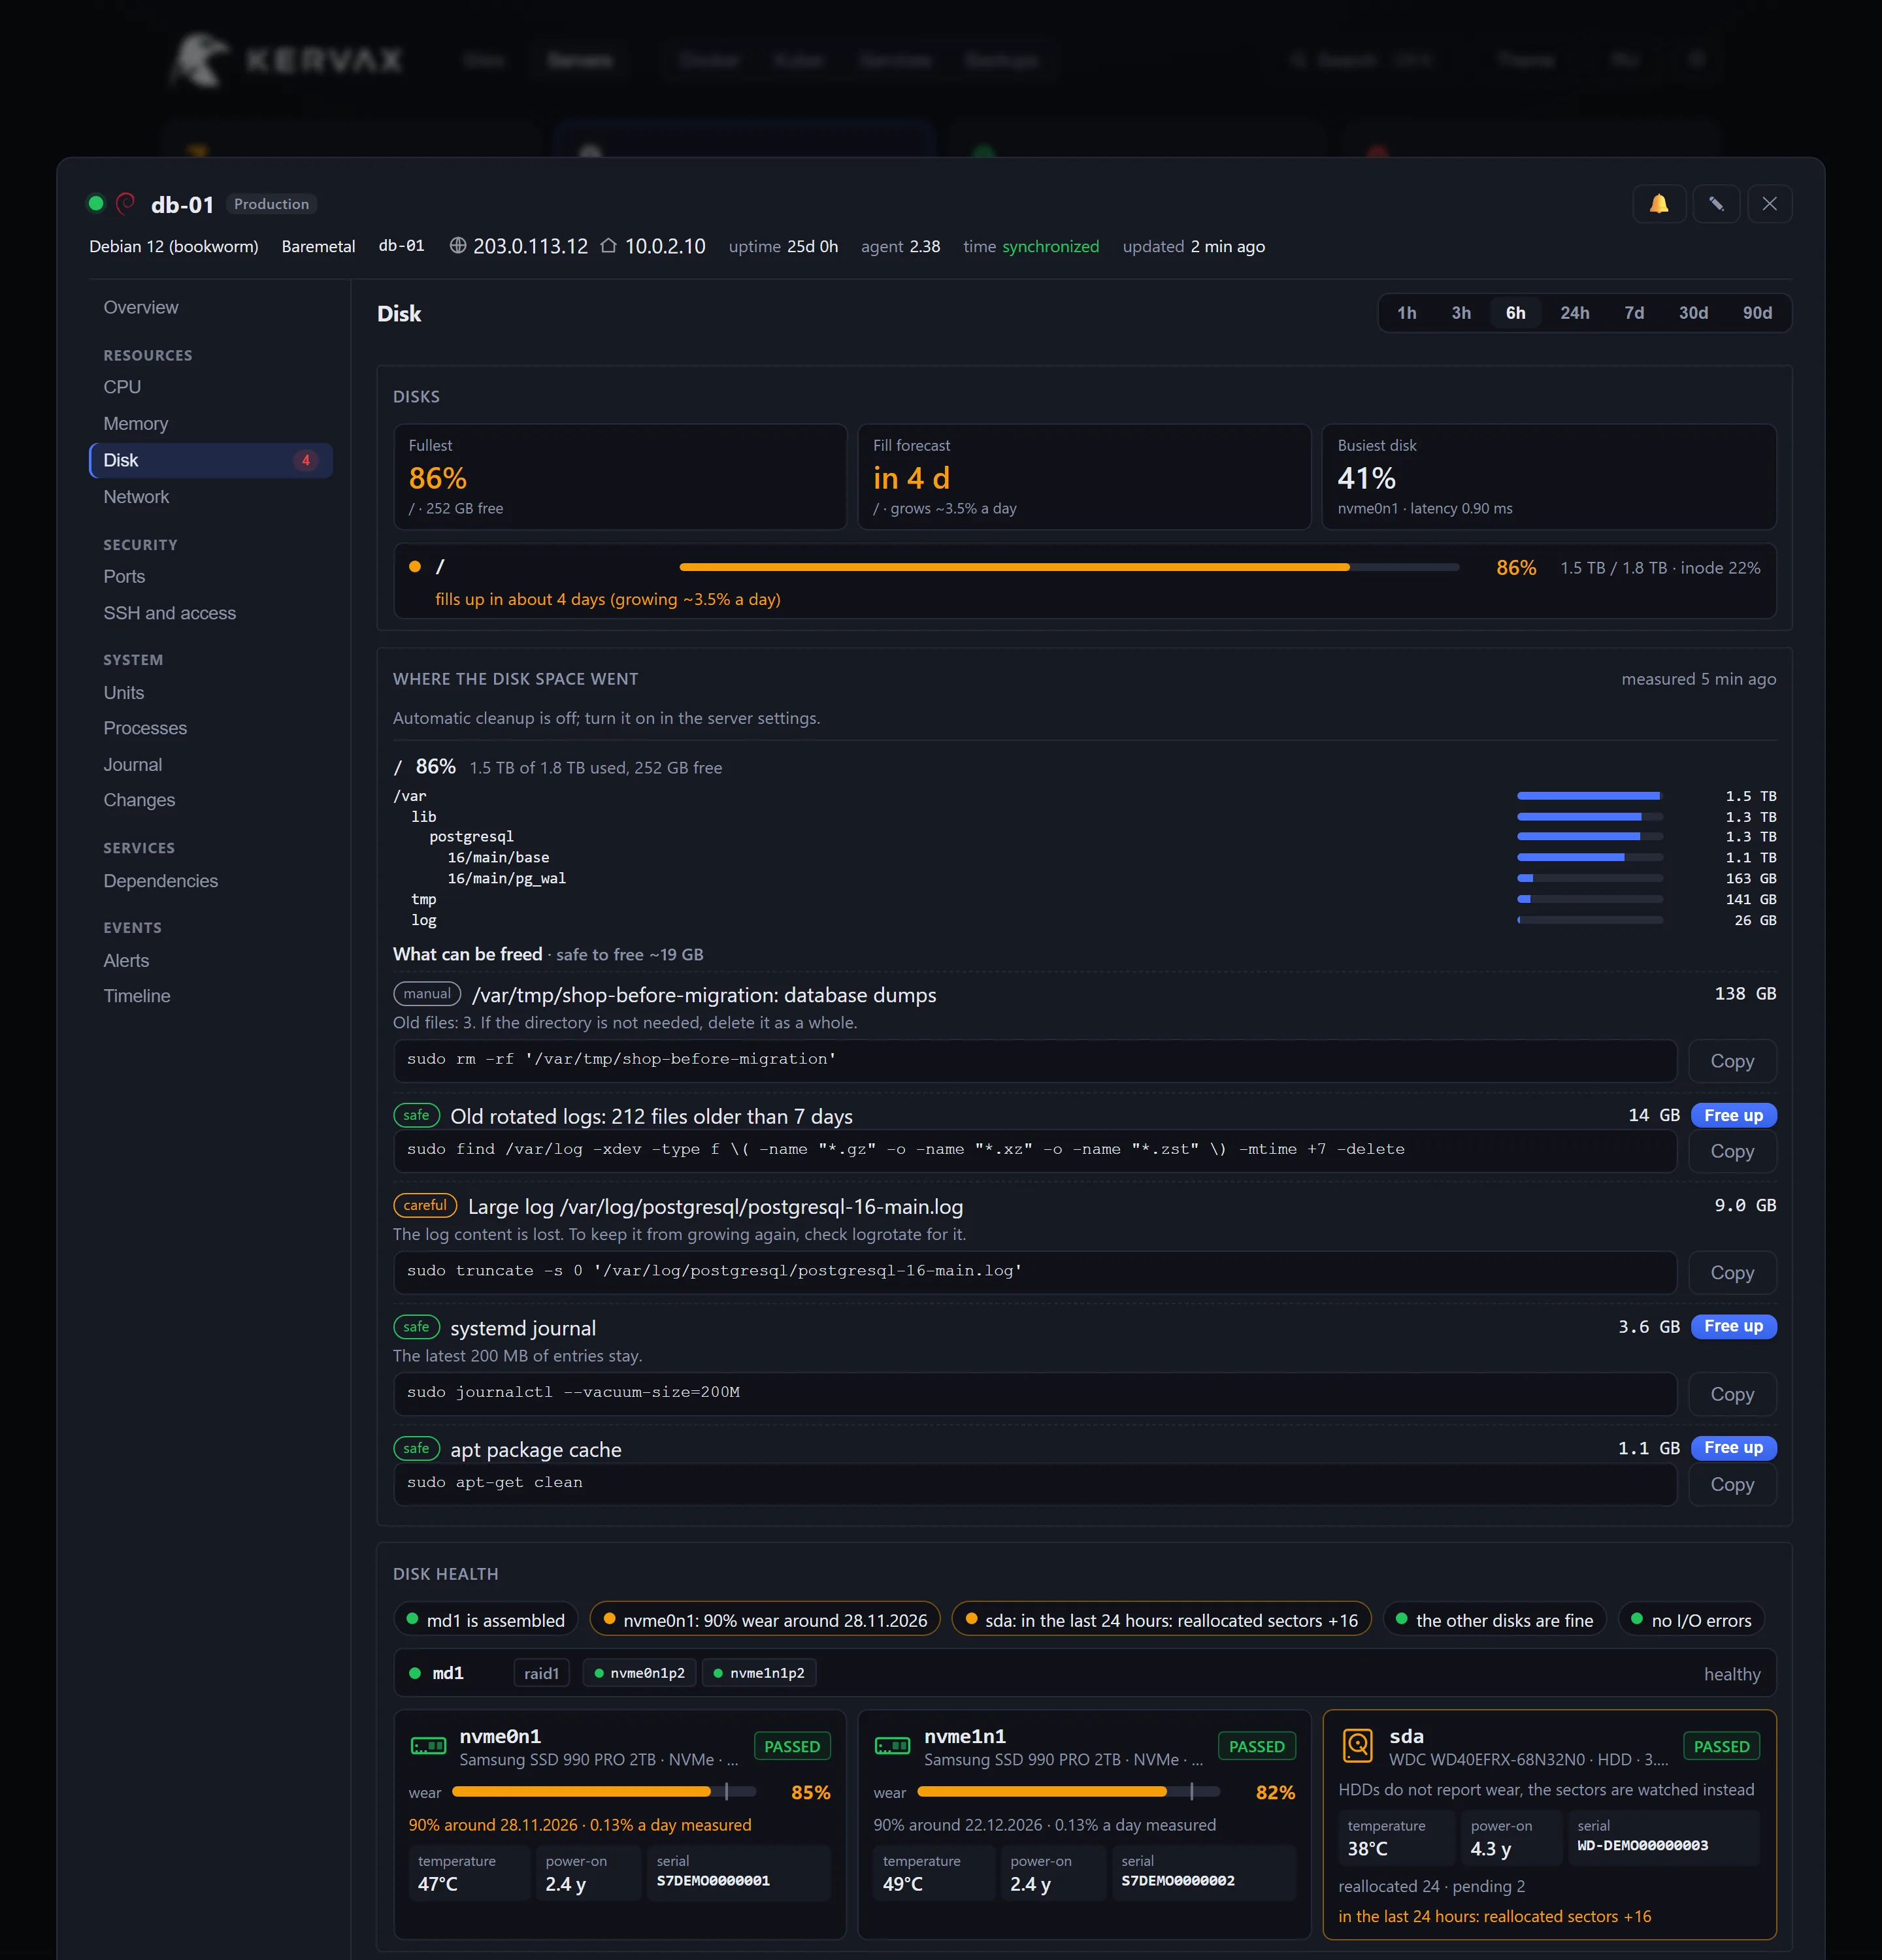
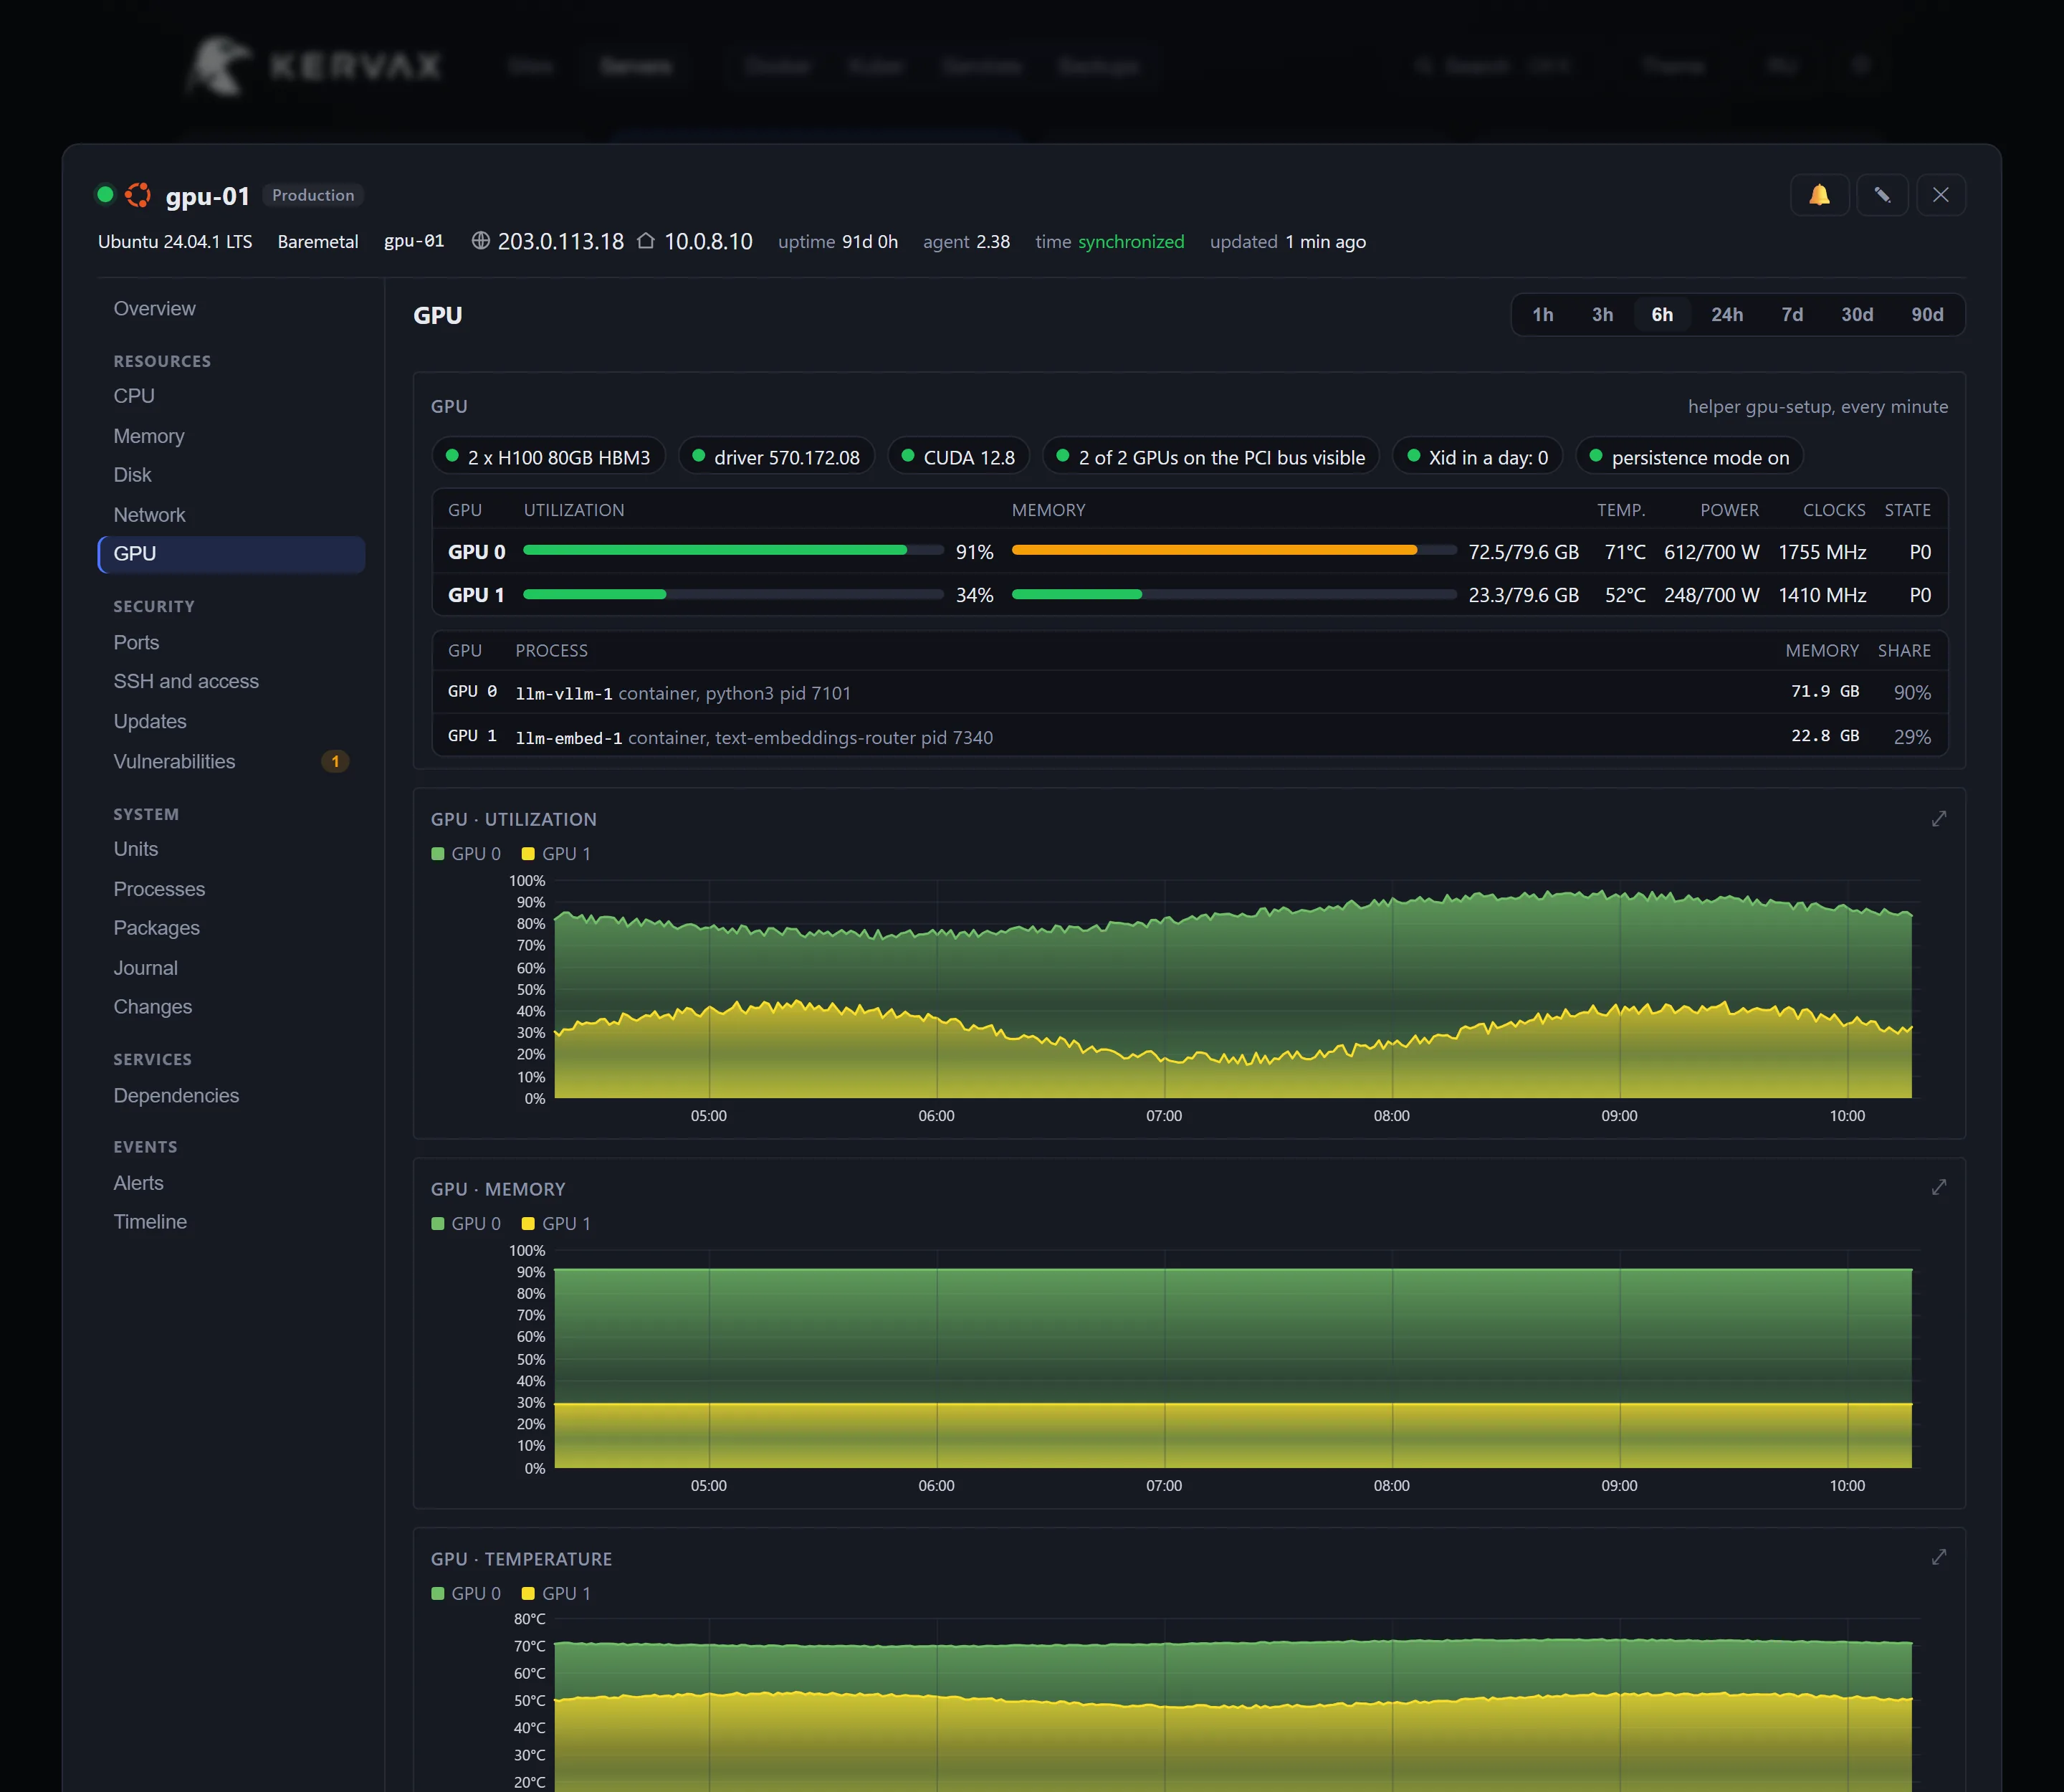
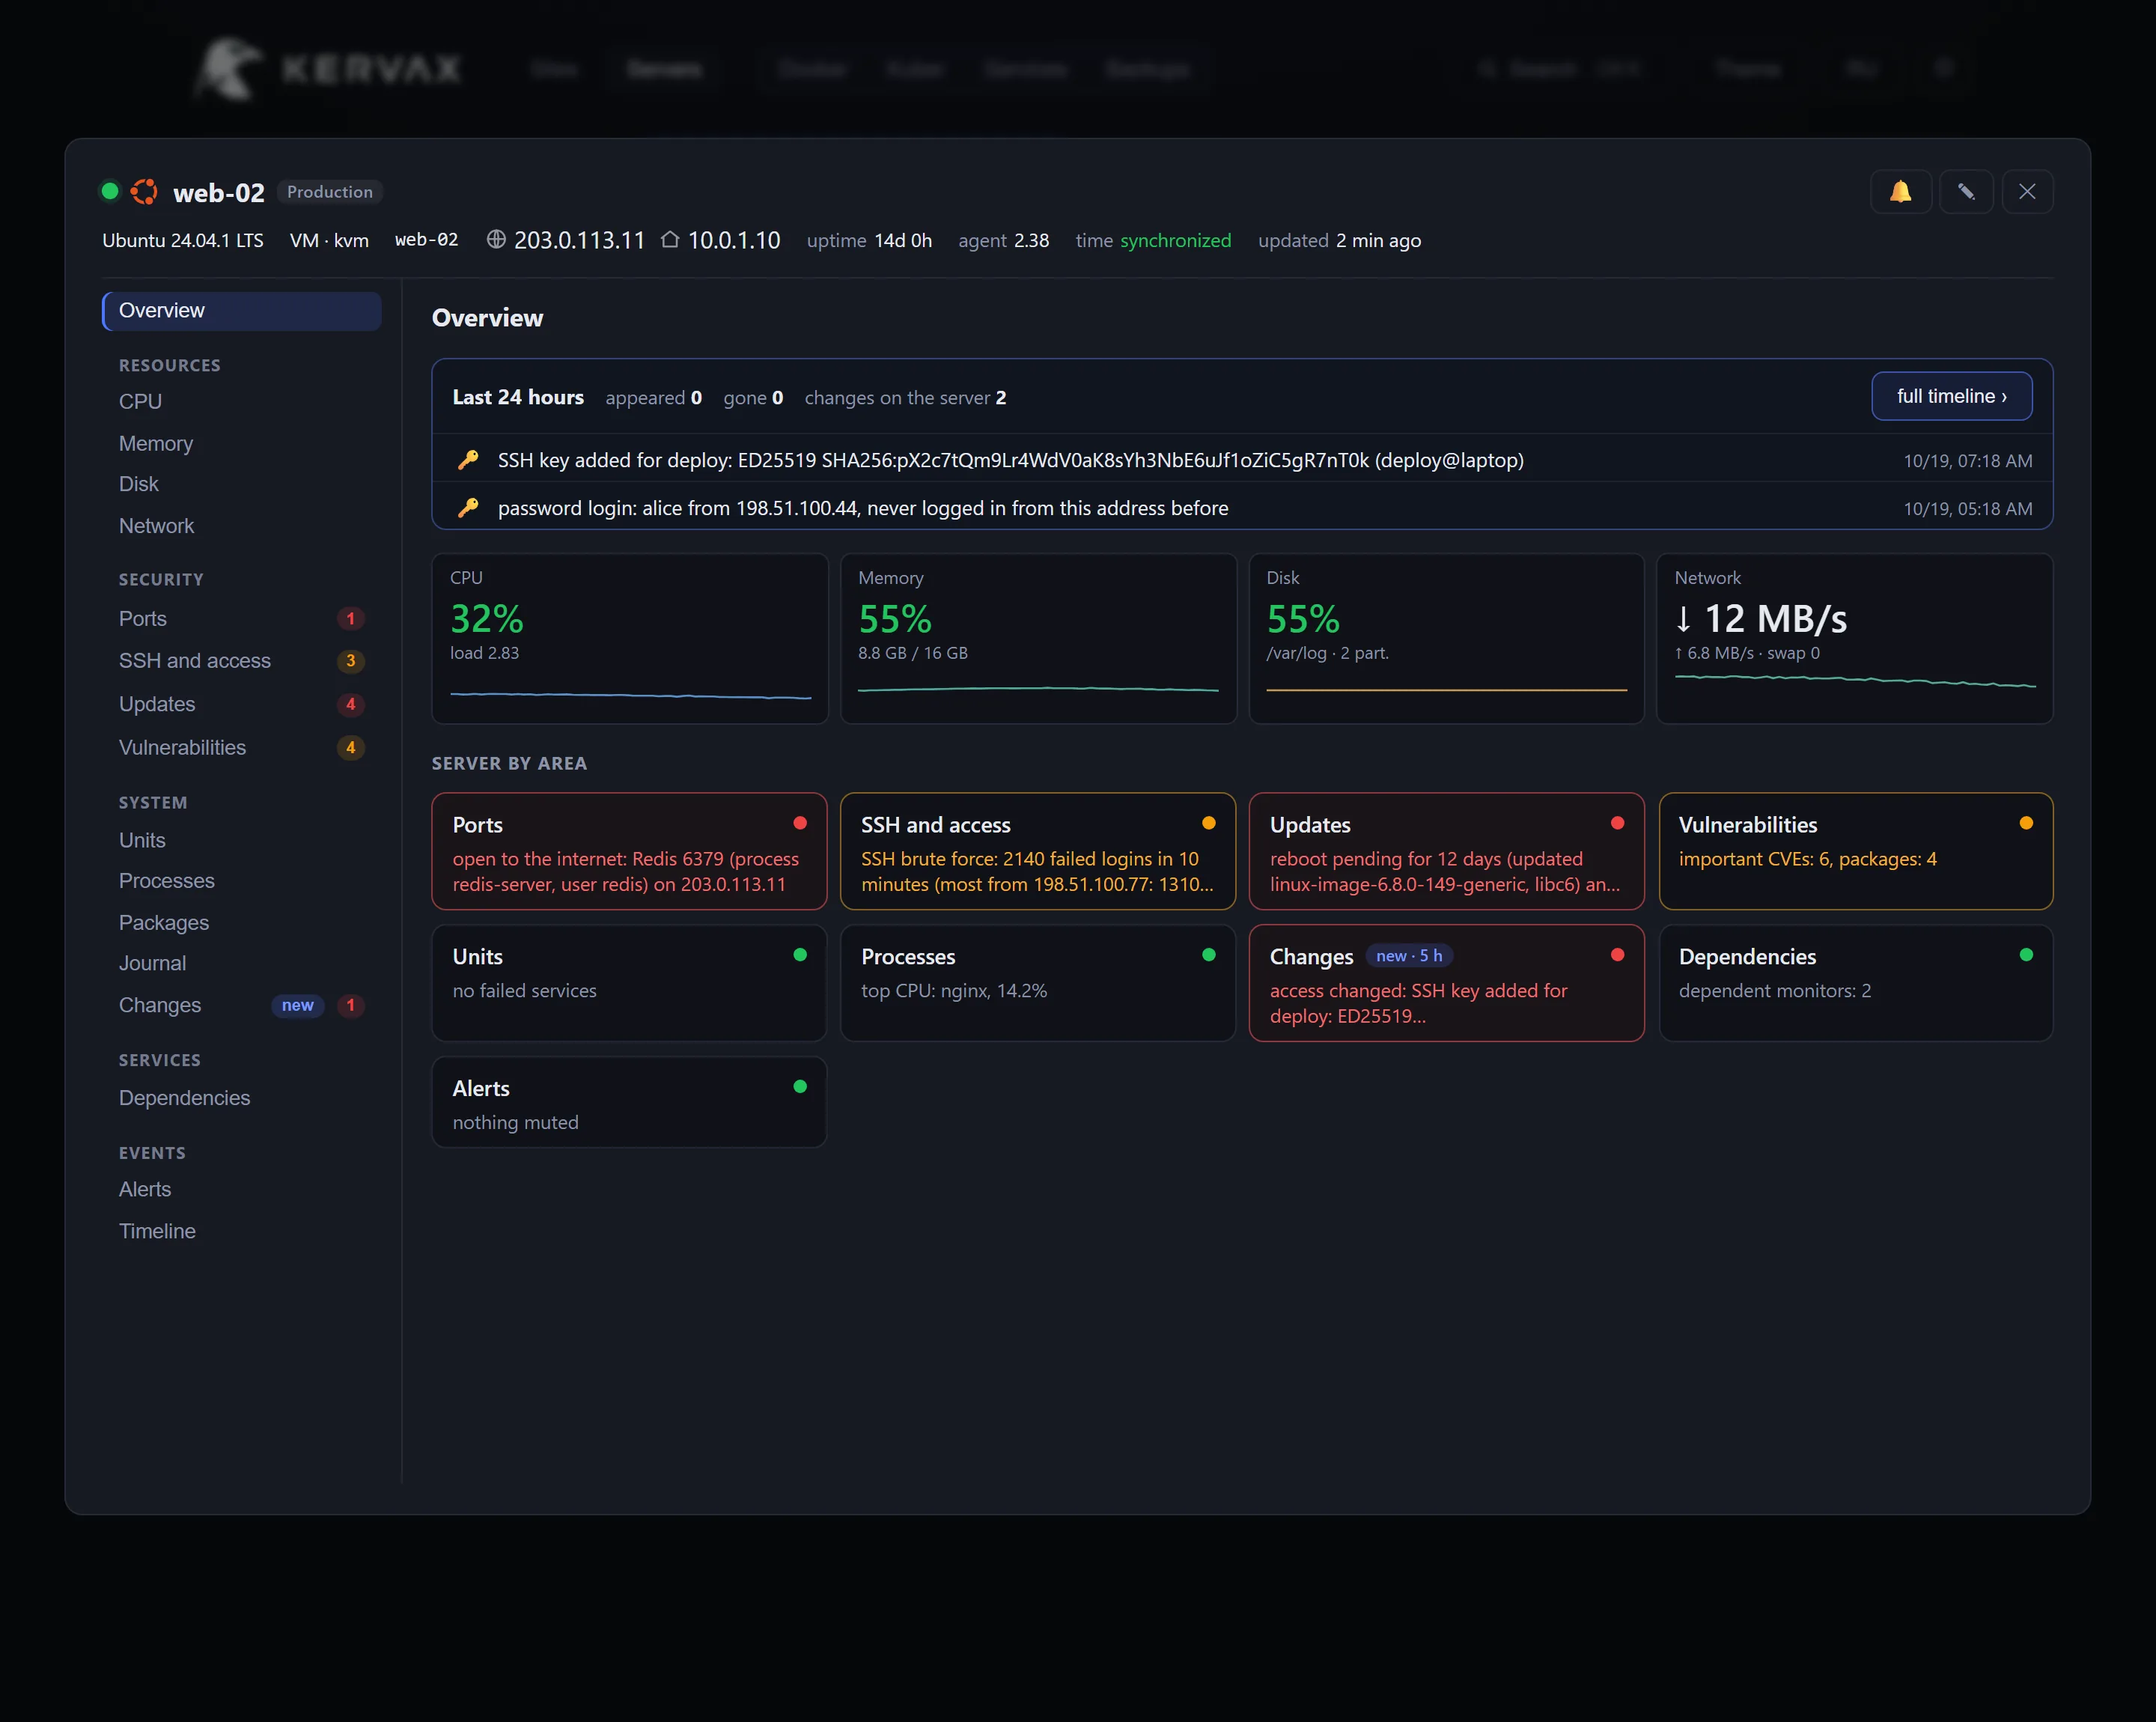
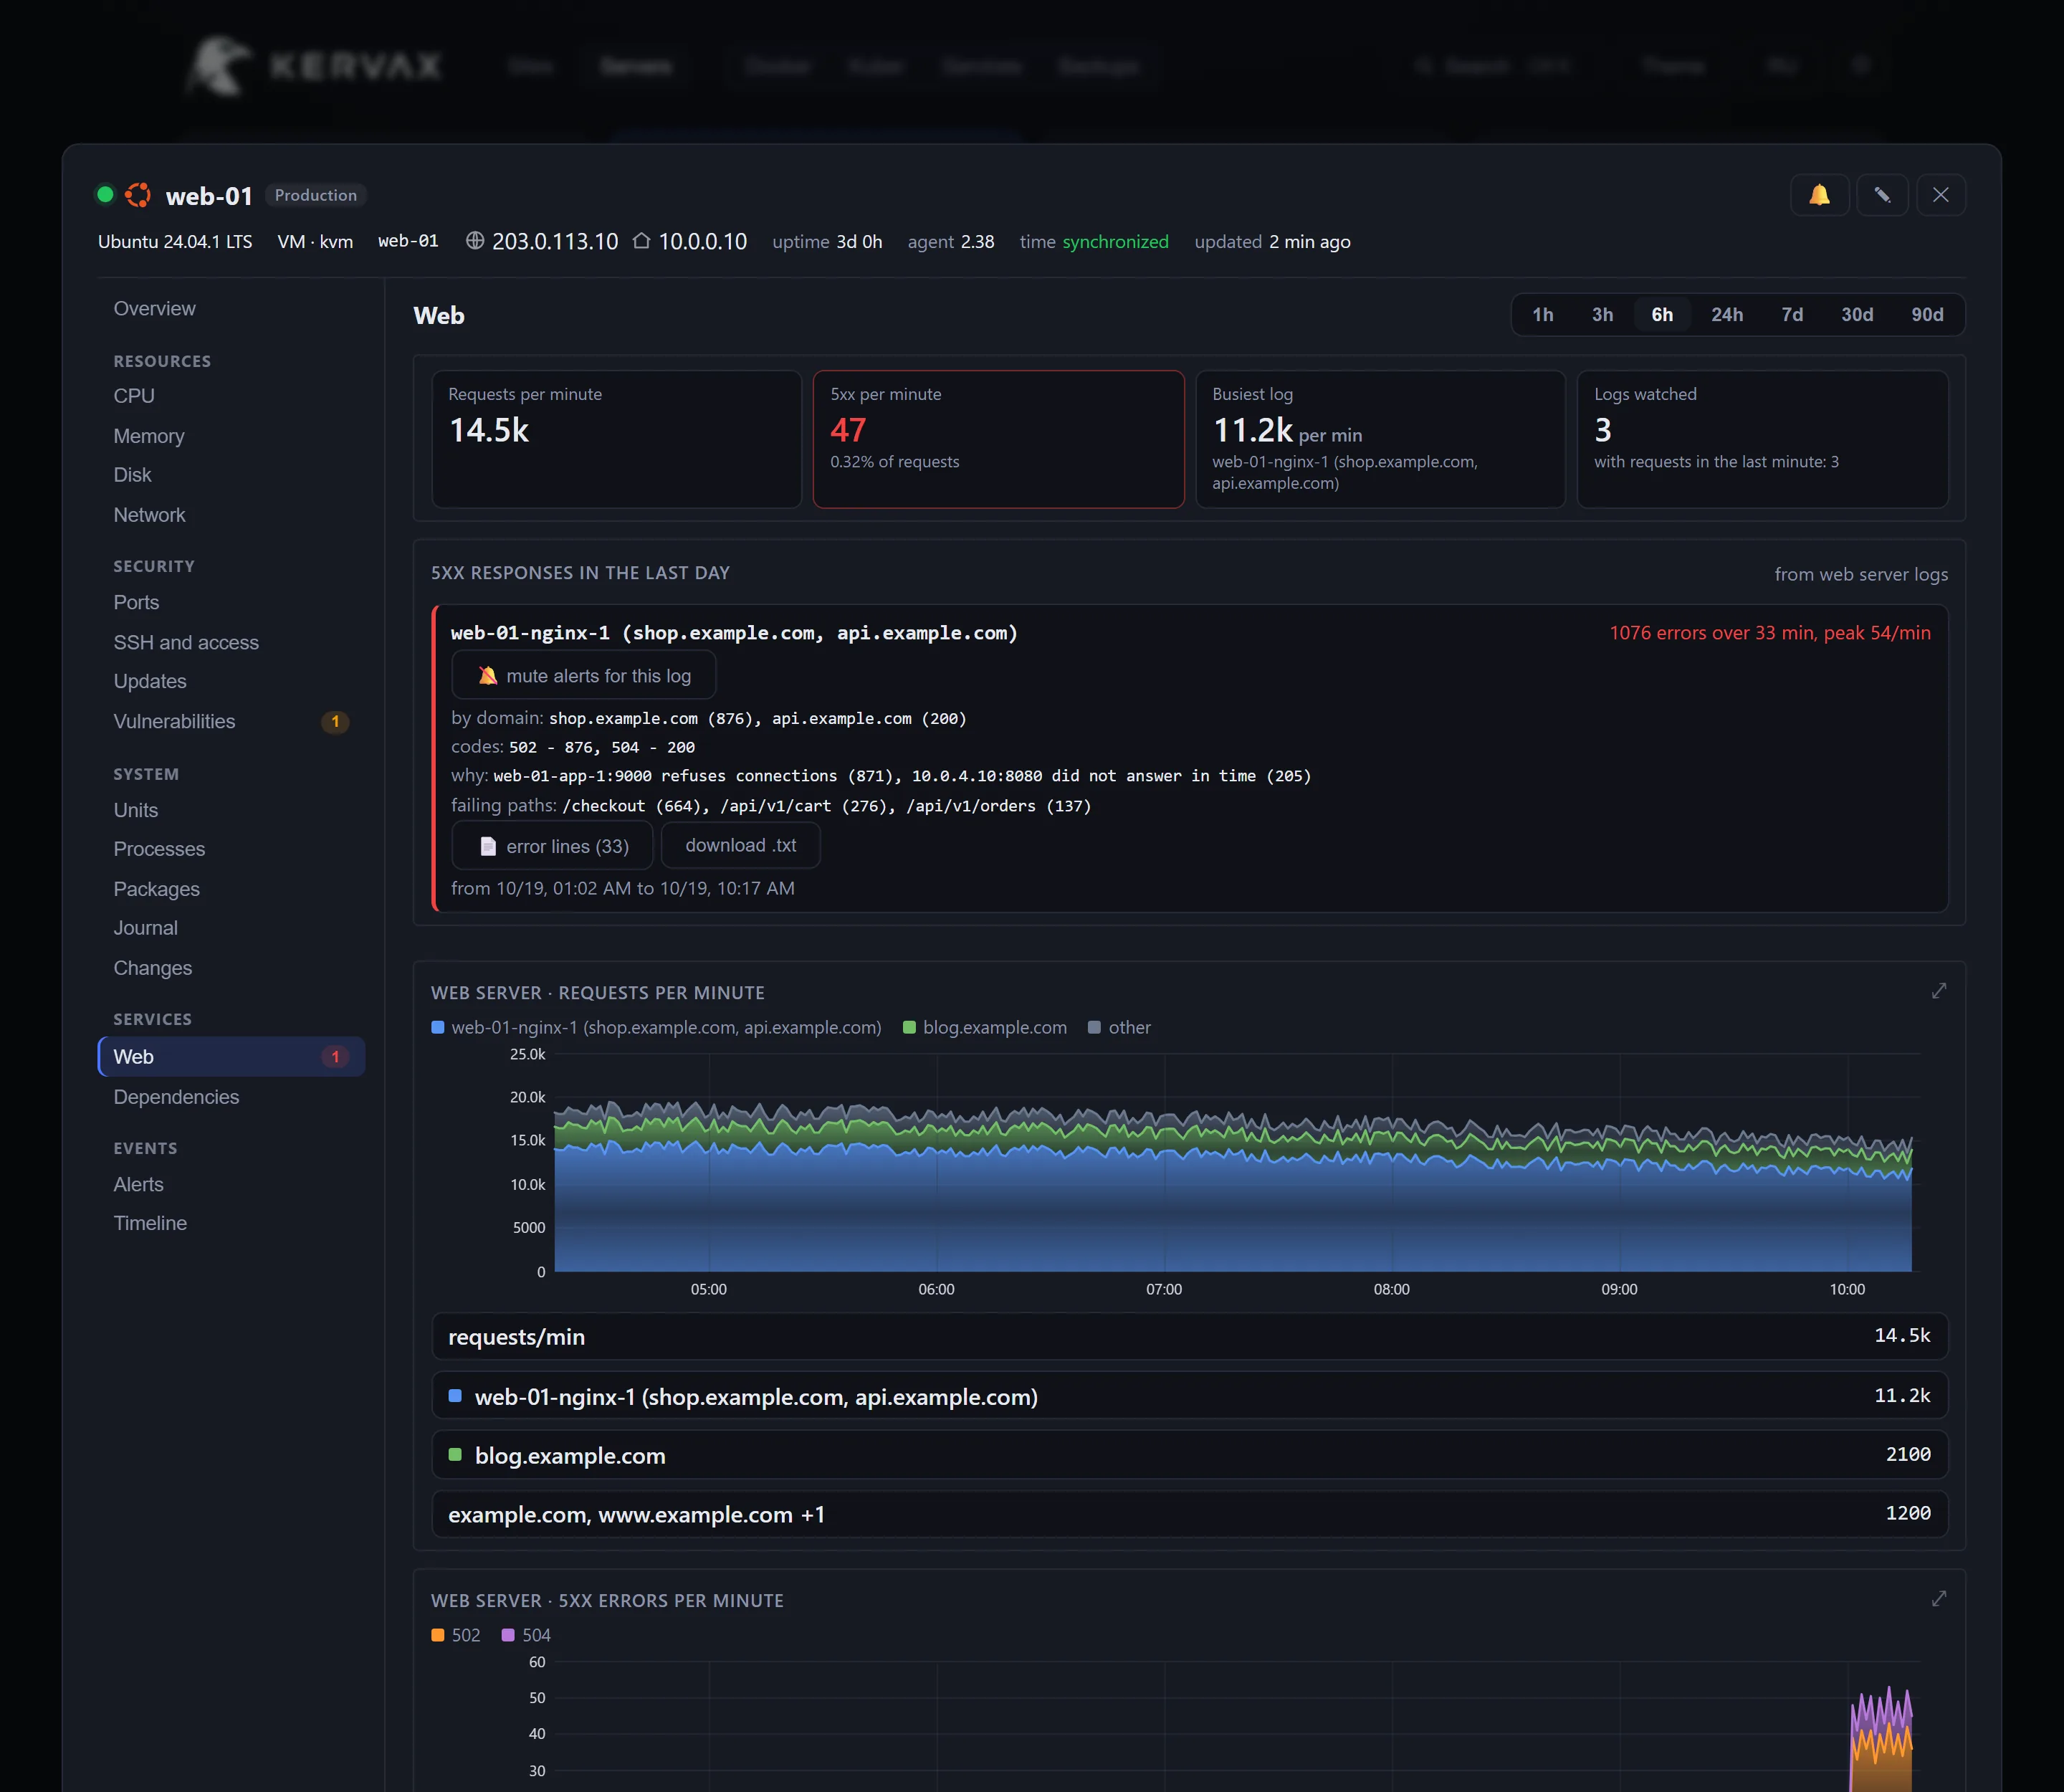
A static binary reports CPU per core, memory, disks per mount, network, temperature, throttling, OOM kills and top processes by load. The connection is outbound only: no port is opened on the node.

What runs on the machine

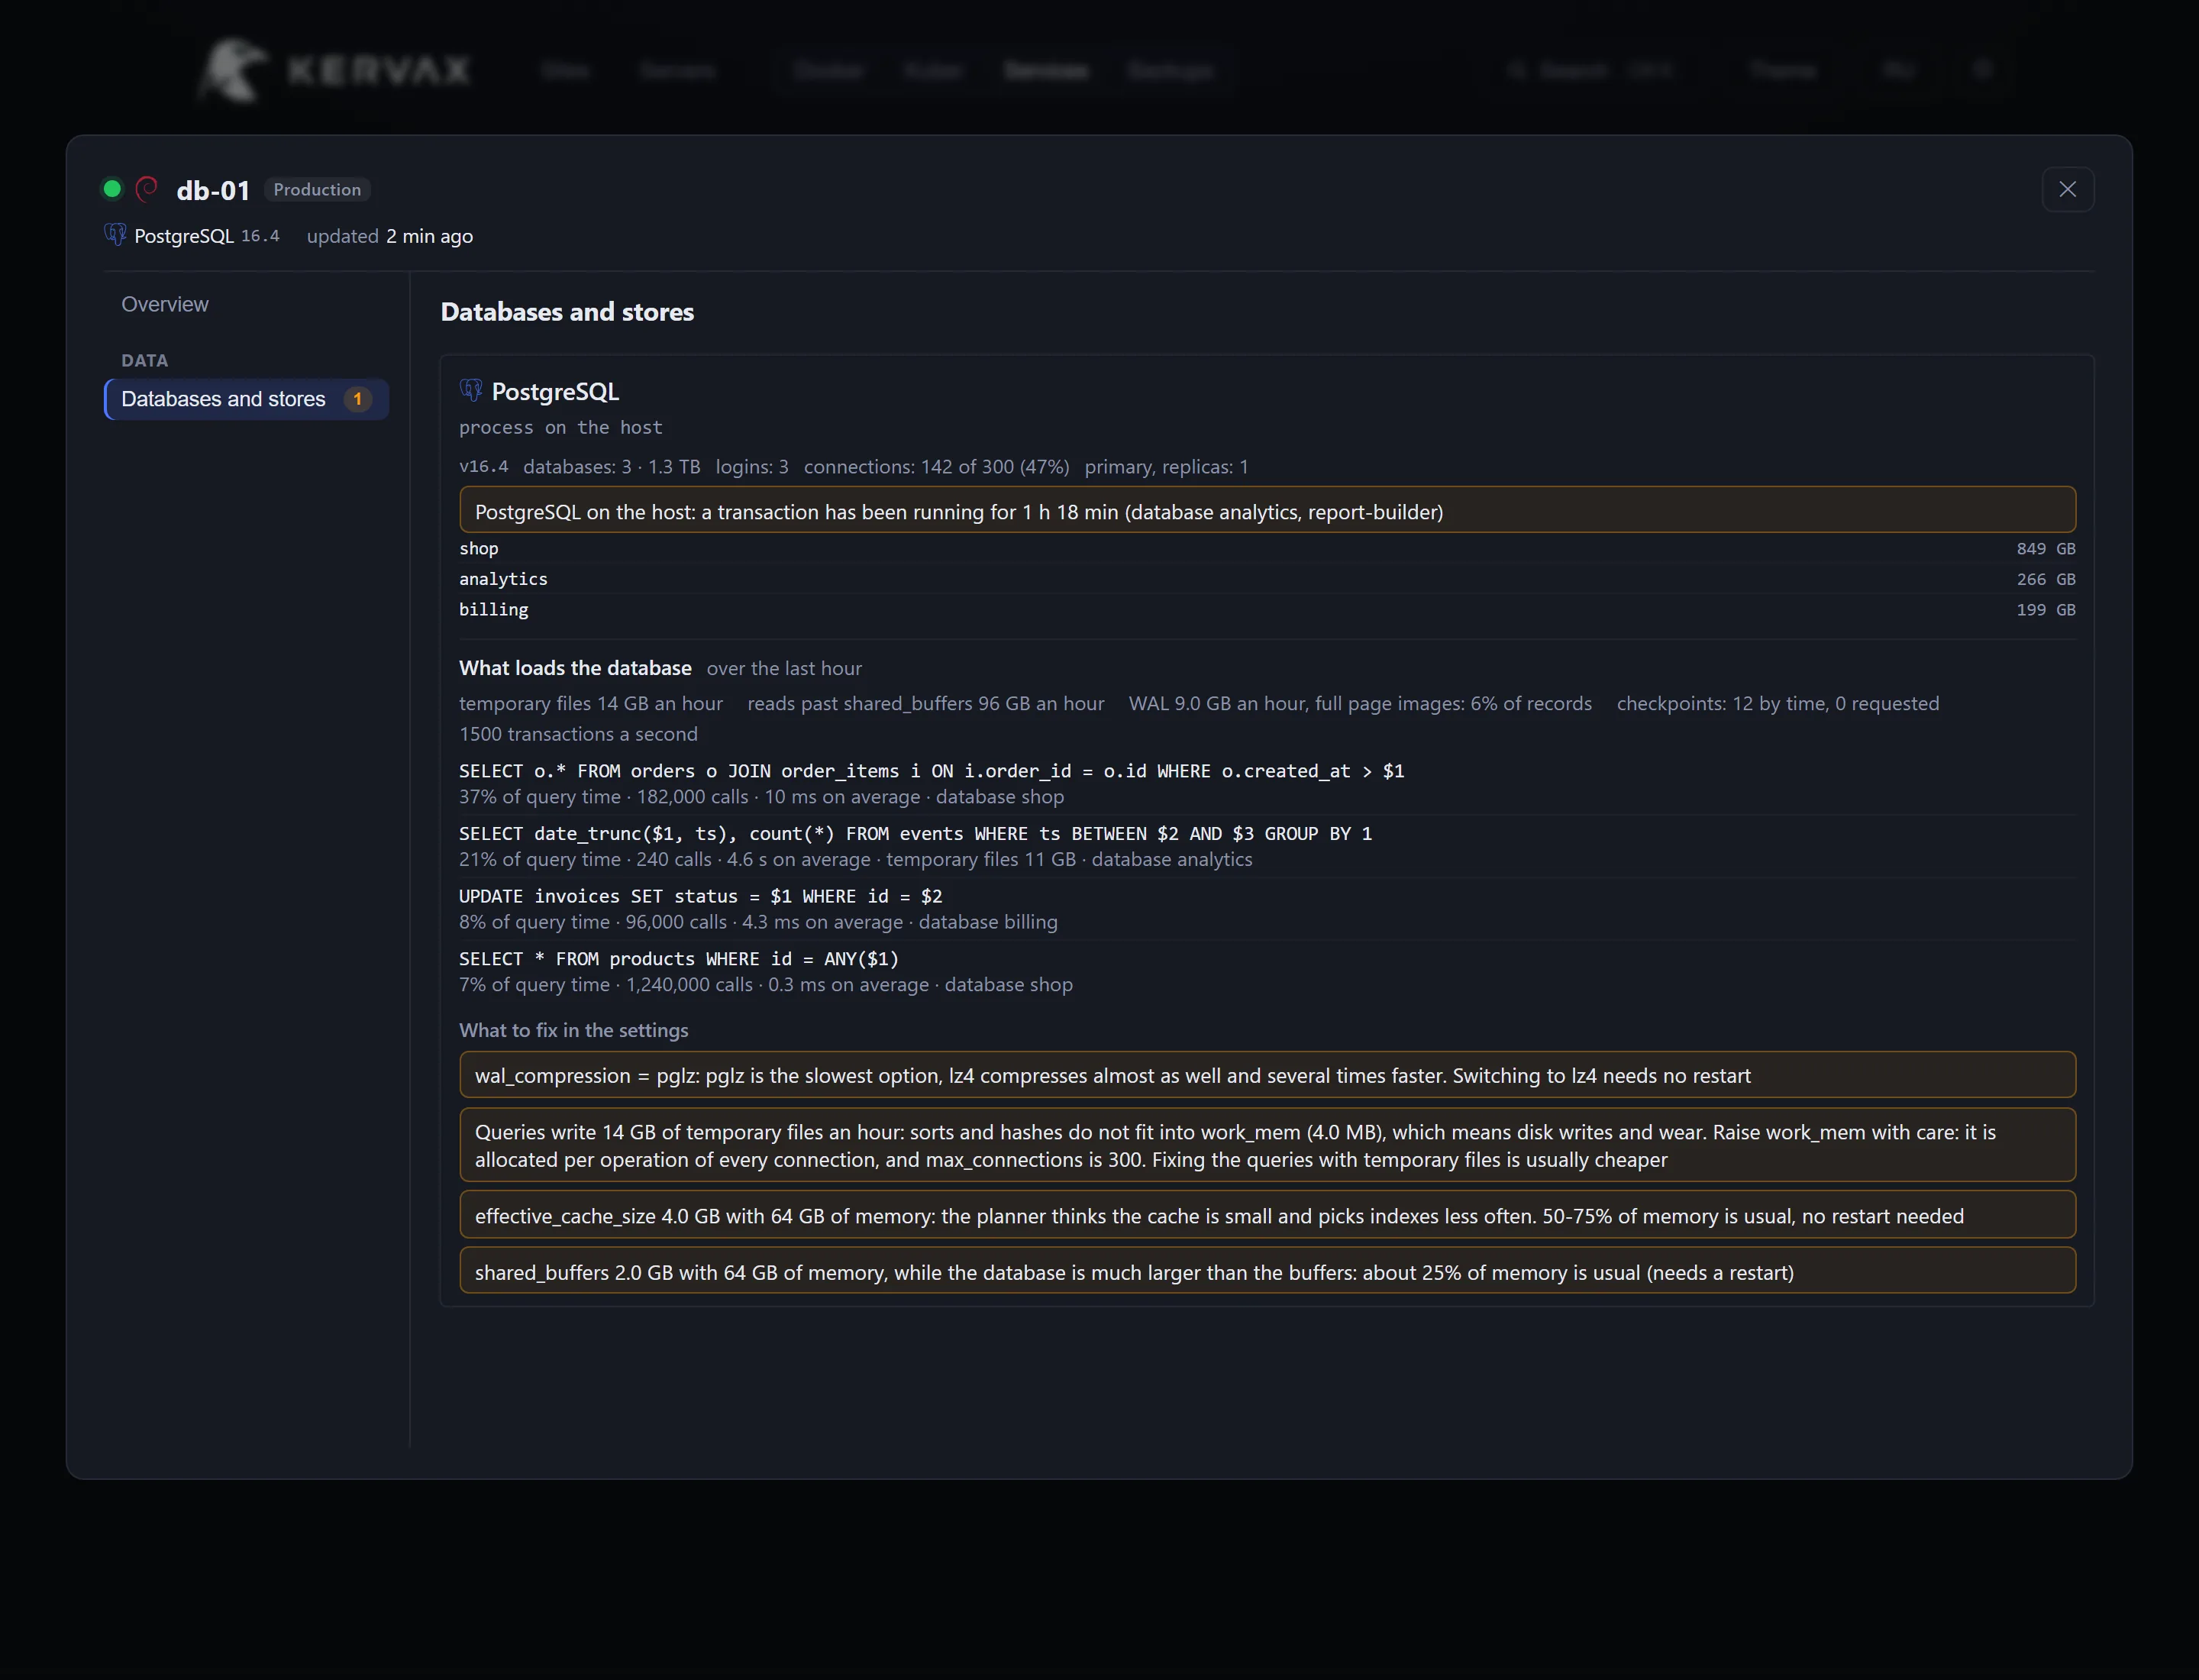
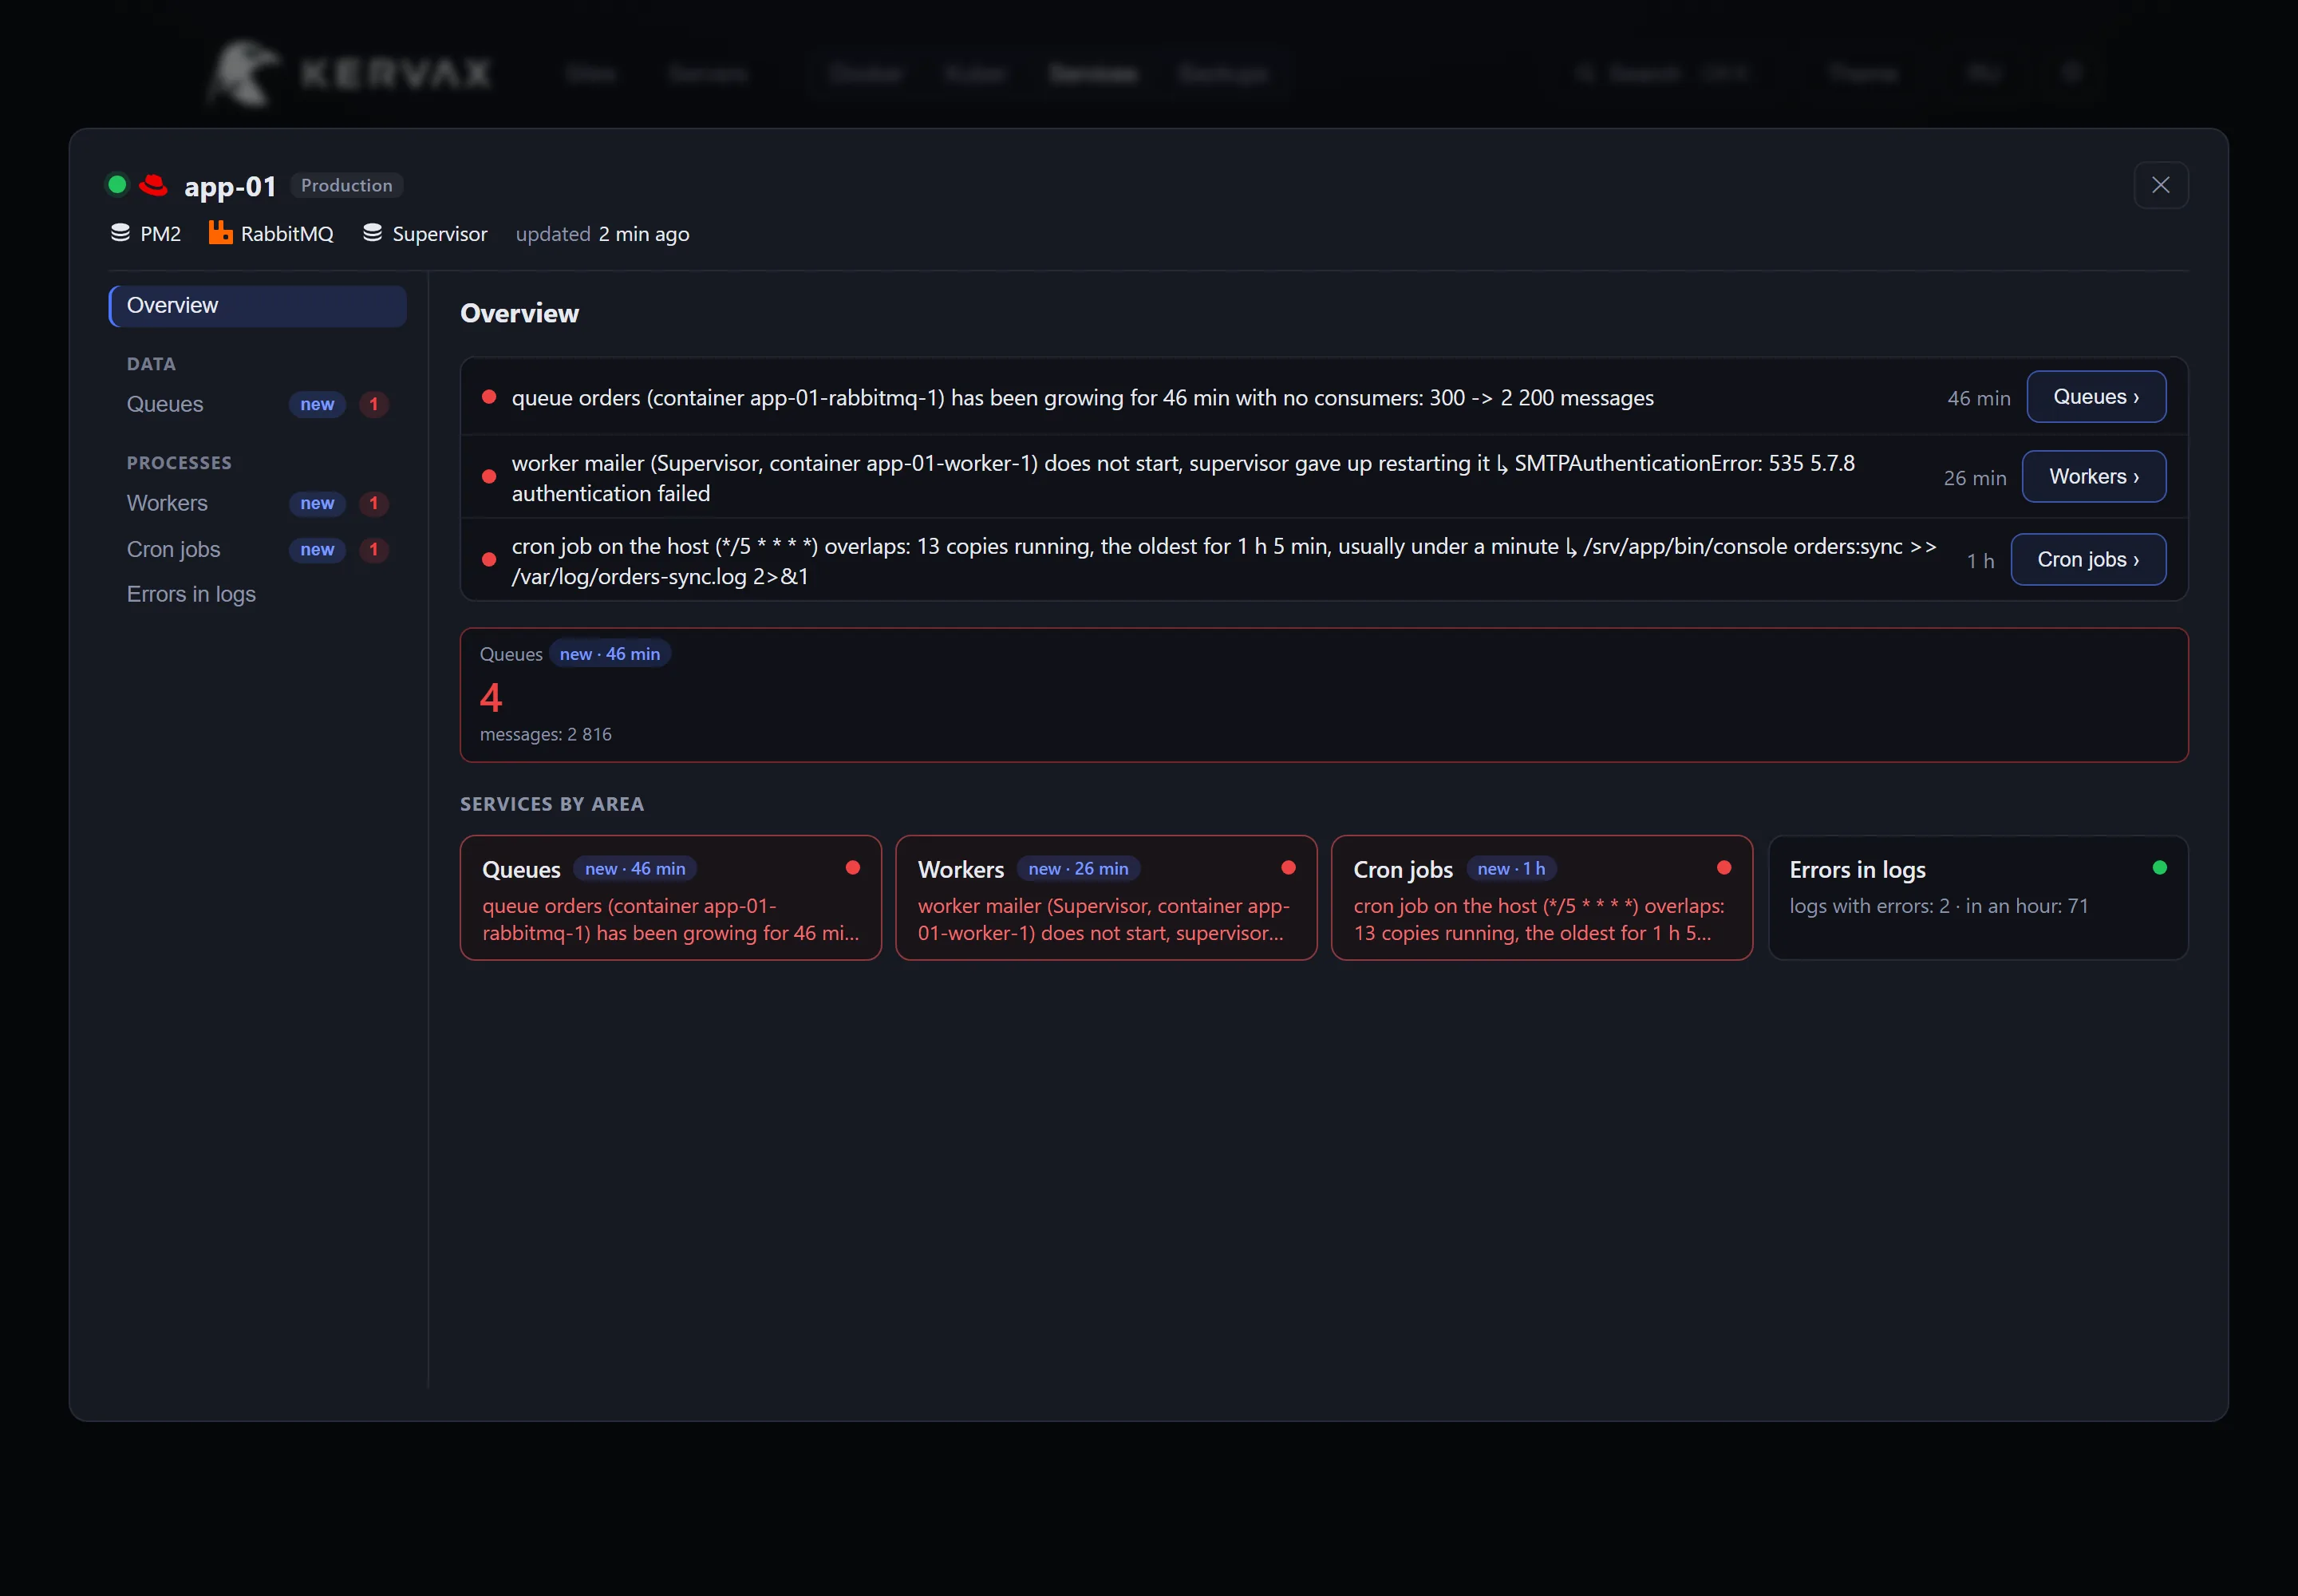
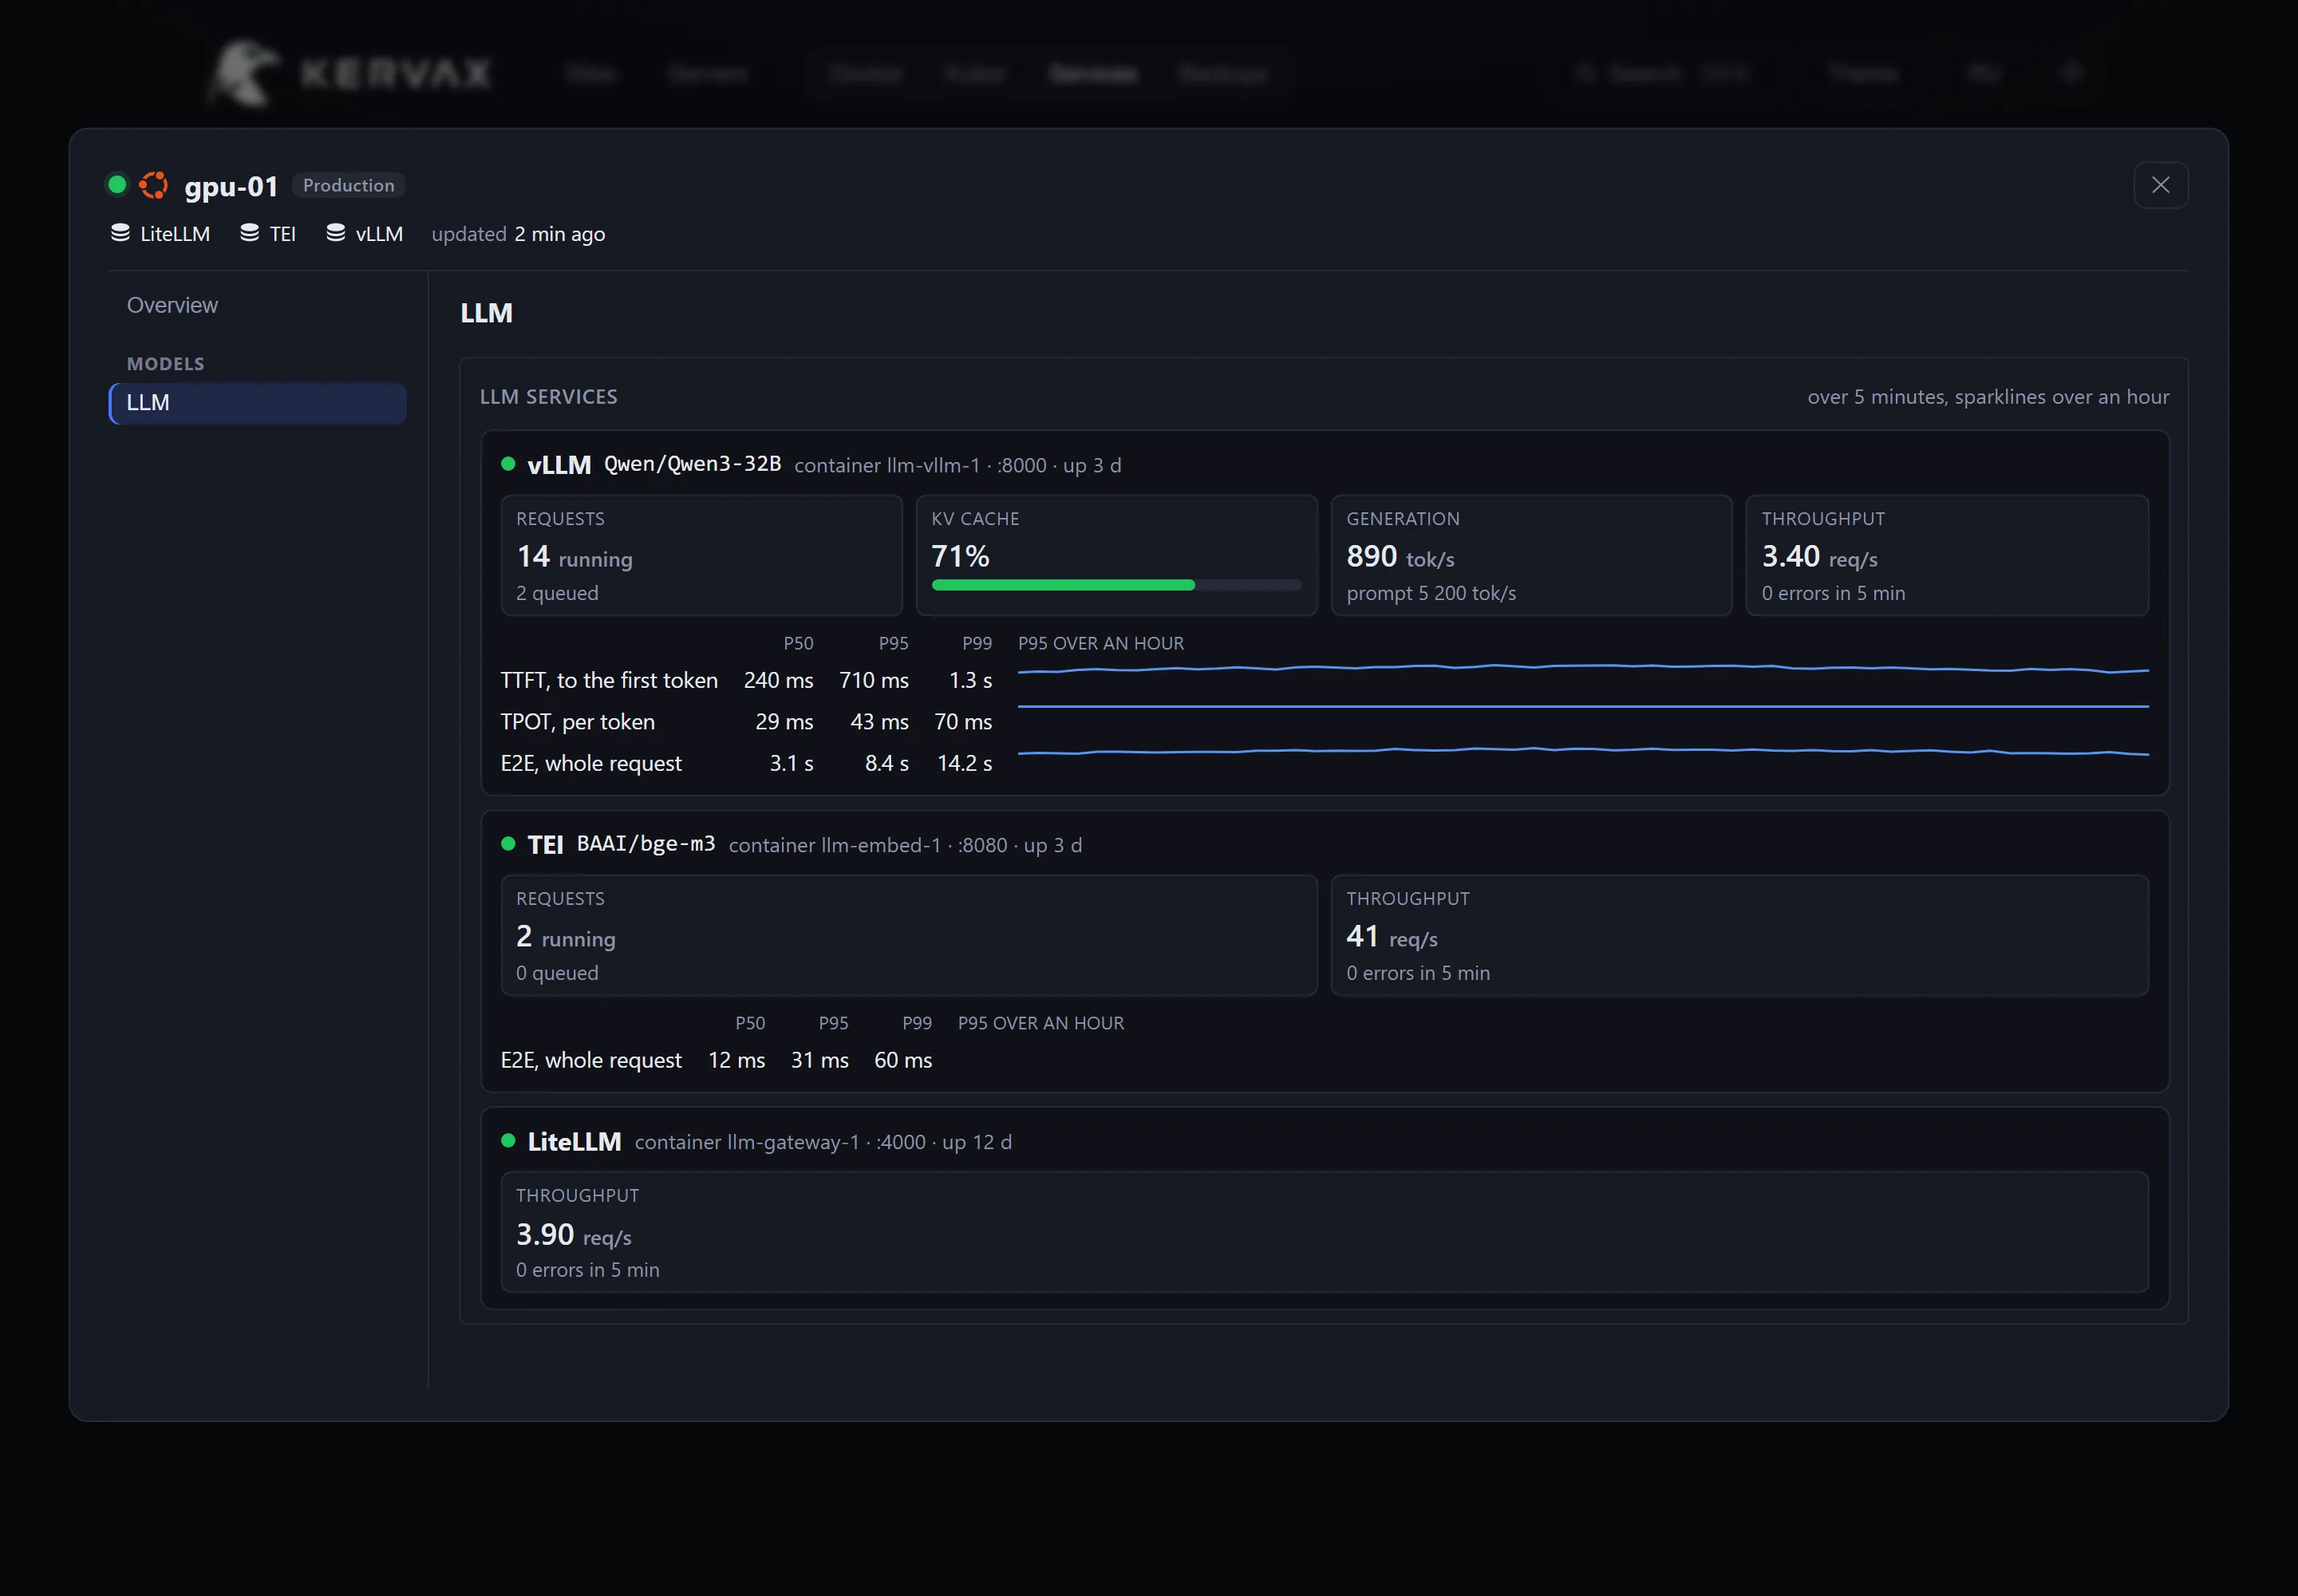
Docker containers, Kubernetes nodes and pods, web servers with the domains they serve, databases with their sizes, RabbitMQ queues. The agent detects all of it; discovered domains are offered for monitoring.

Backups

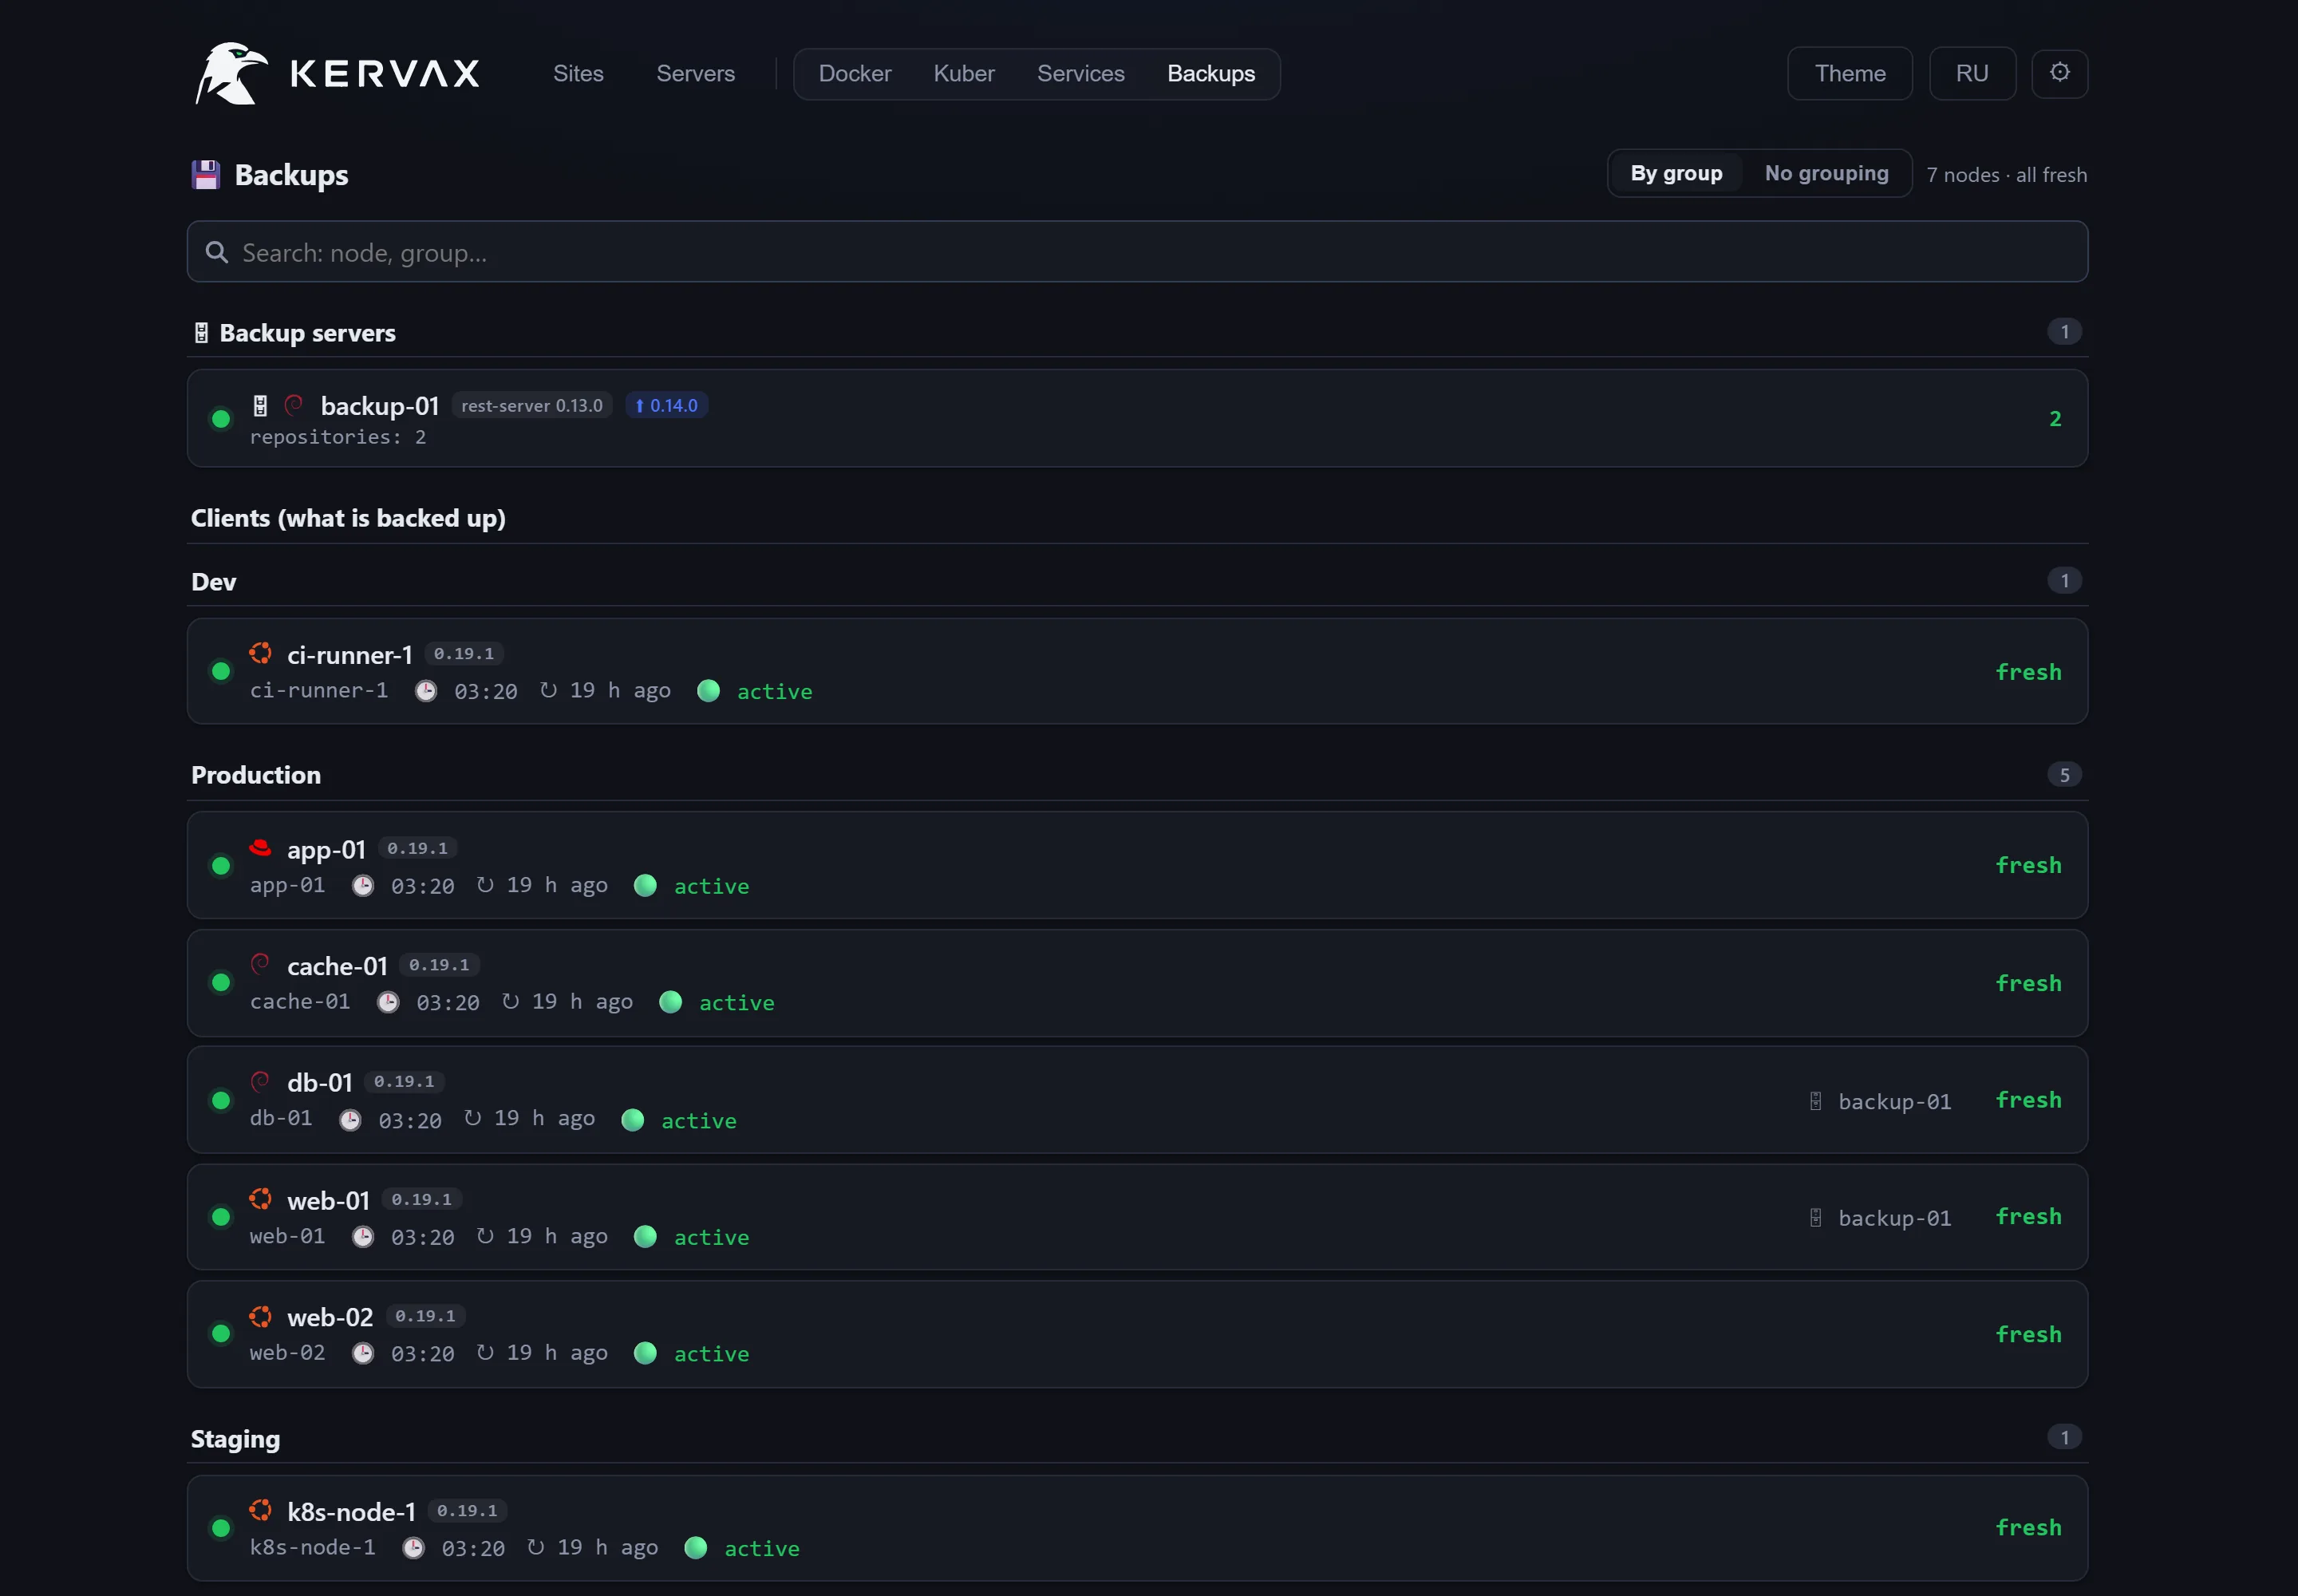
restic state per node: time of the last snapshot, its result, whether the run fit the configured window. A backup server and its clients can be provisioned from the panel. Restore credentials live in a vault encrypted in the browser — the server only ever holds ciphertext.

Alerts

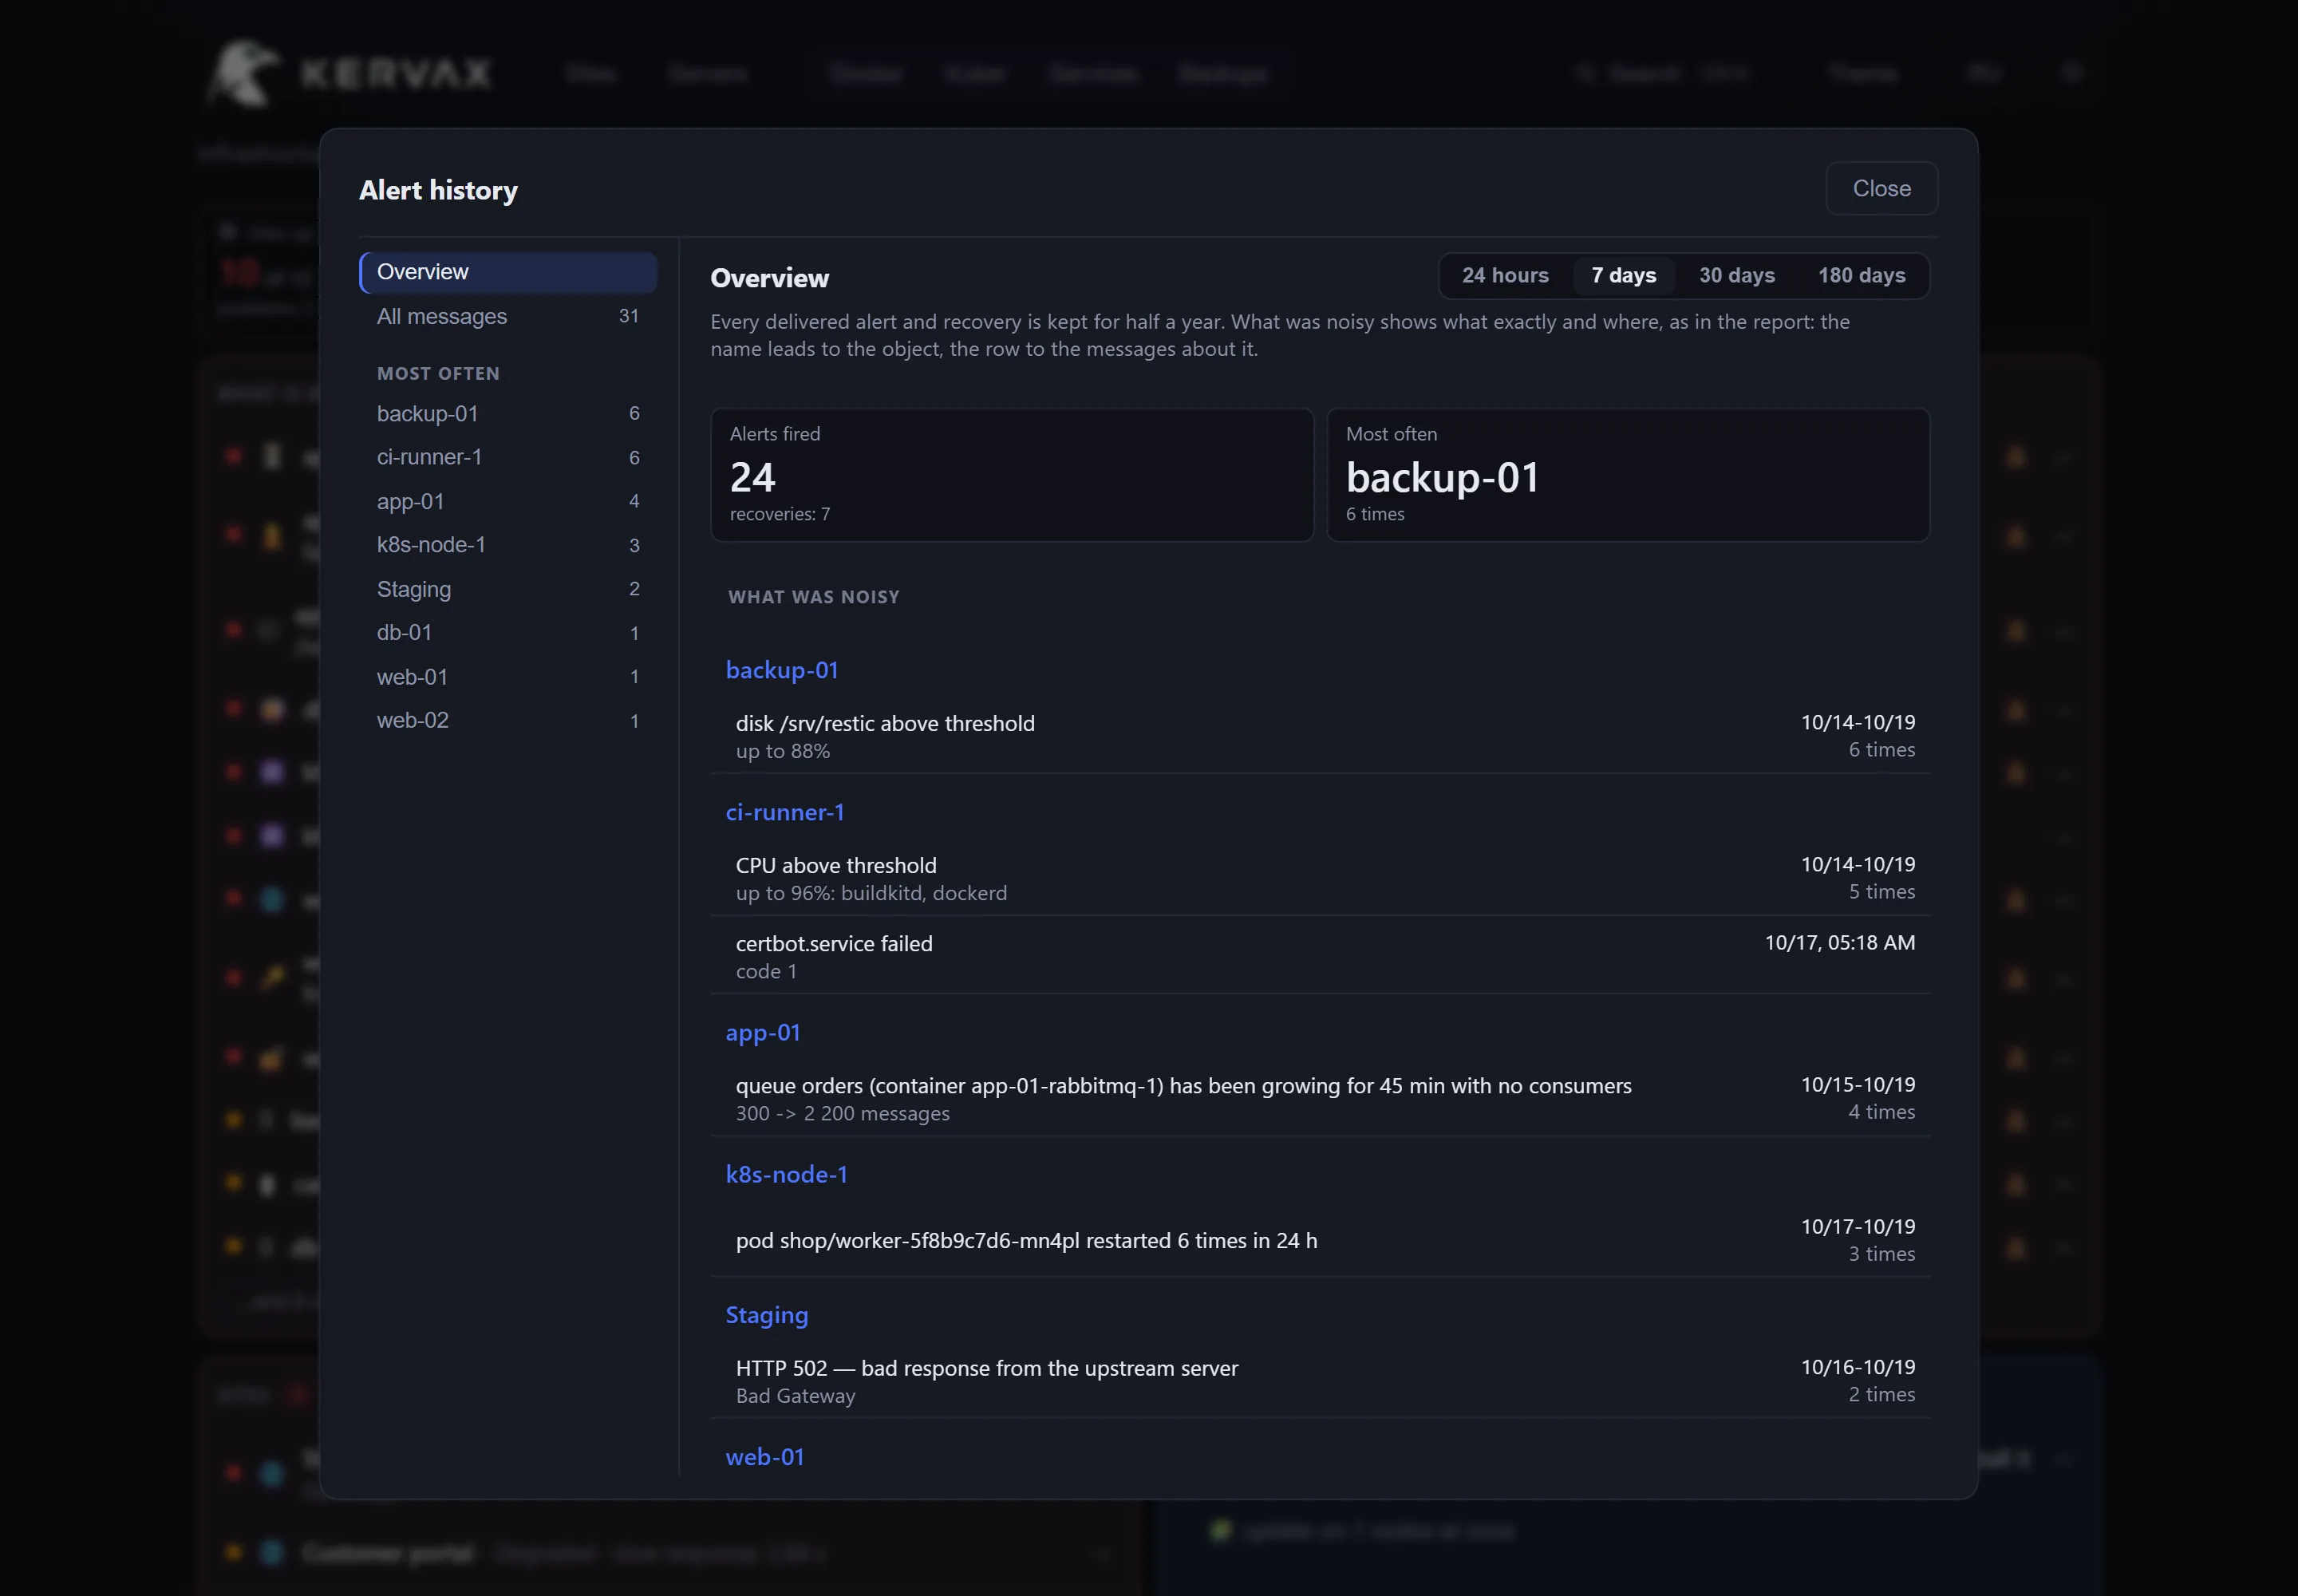
Telegram and webhooks, with your own text per alert type. A threshold fires only after it holds for a set time, so single spikes do not create incidents. Snooze, per-type muting and routing by roles and groups are supported.

Self-checks

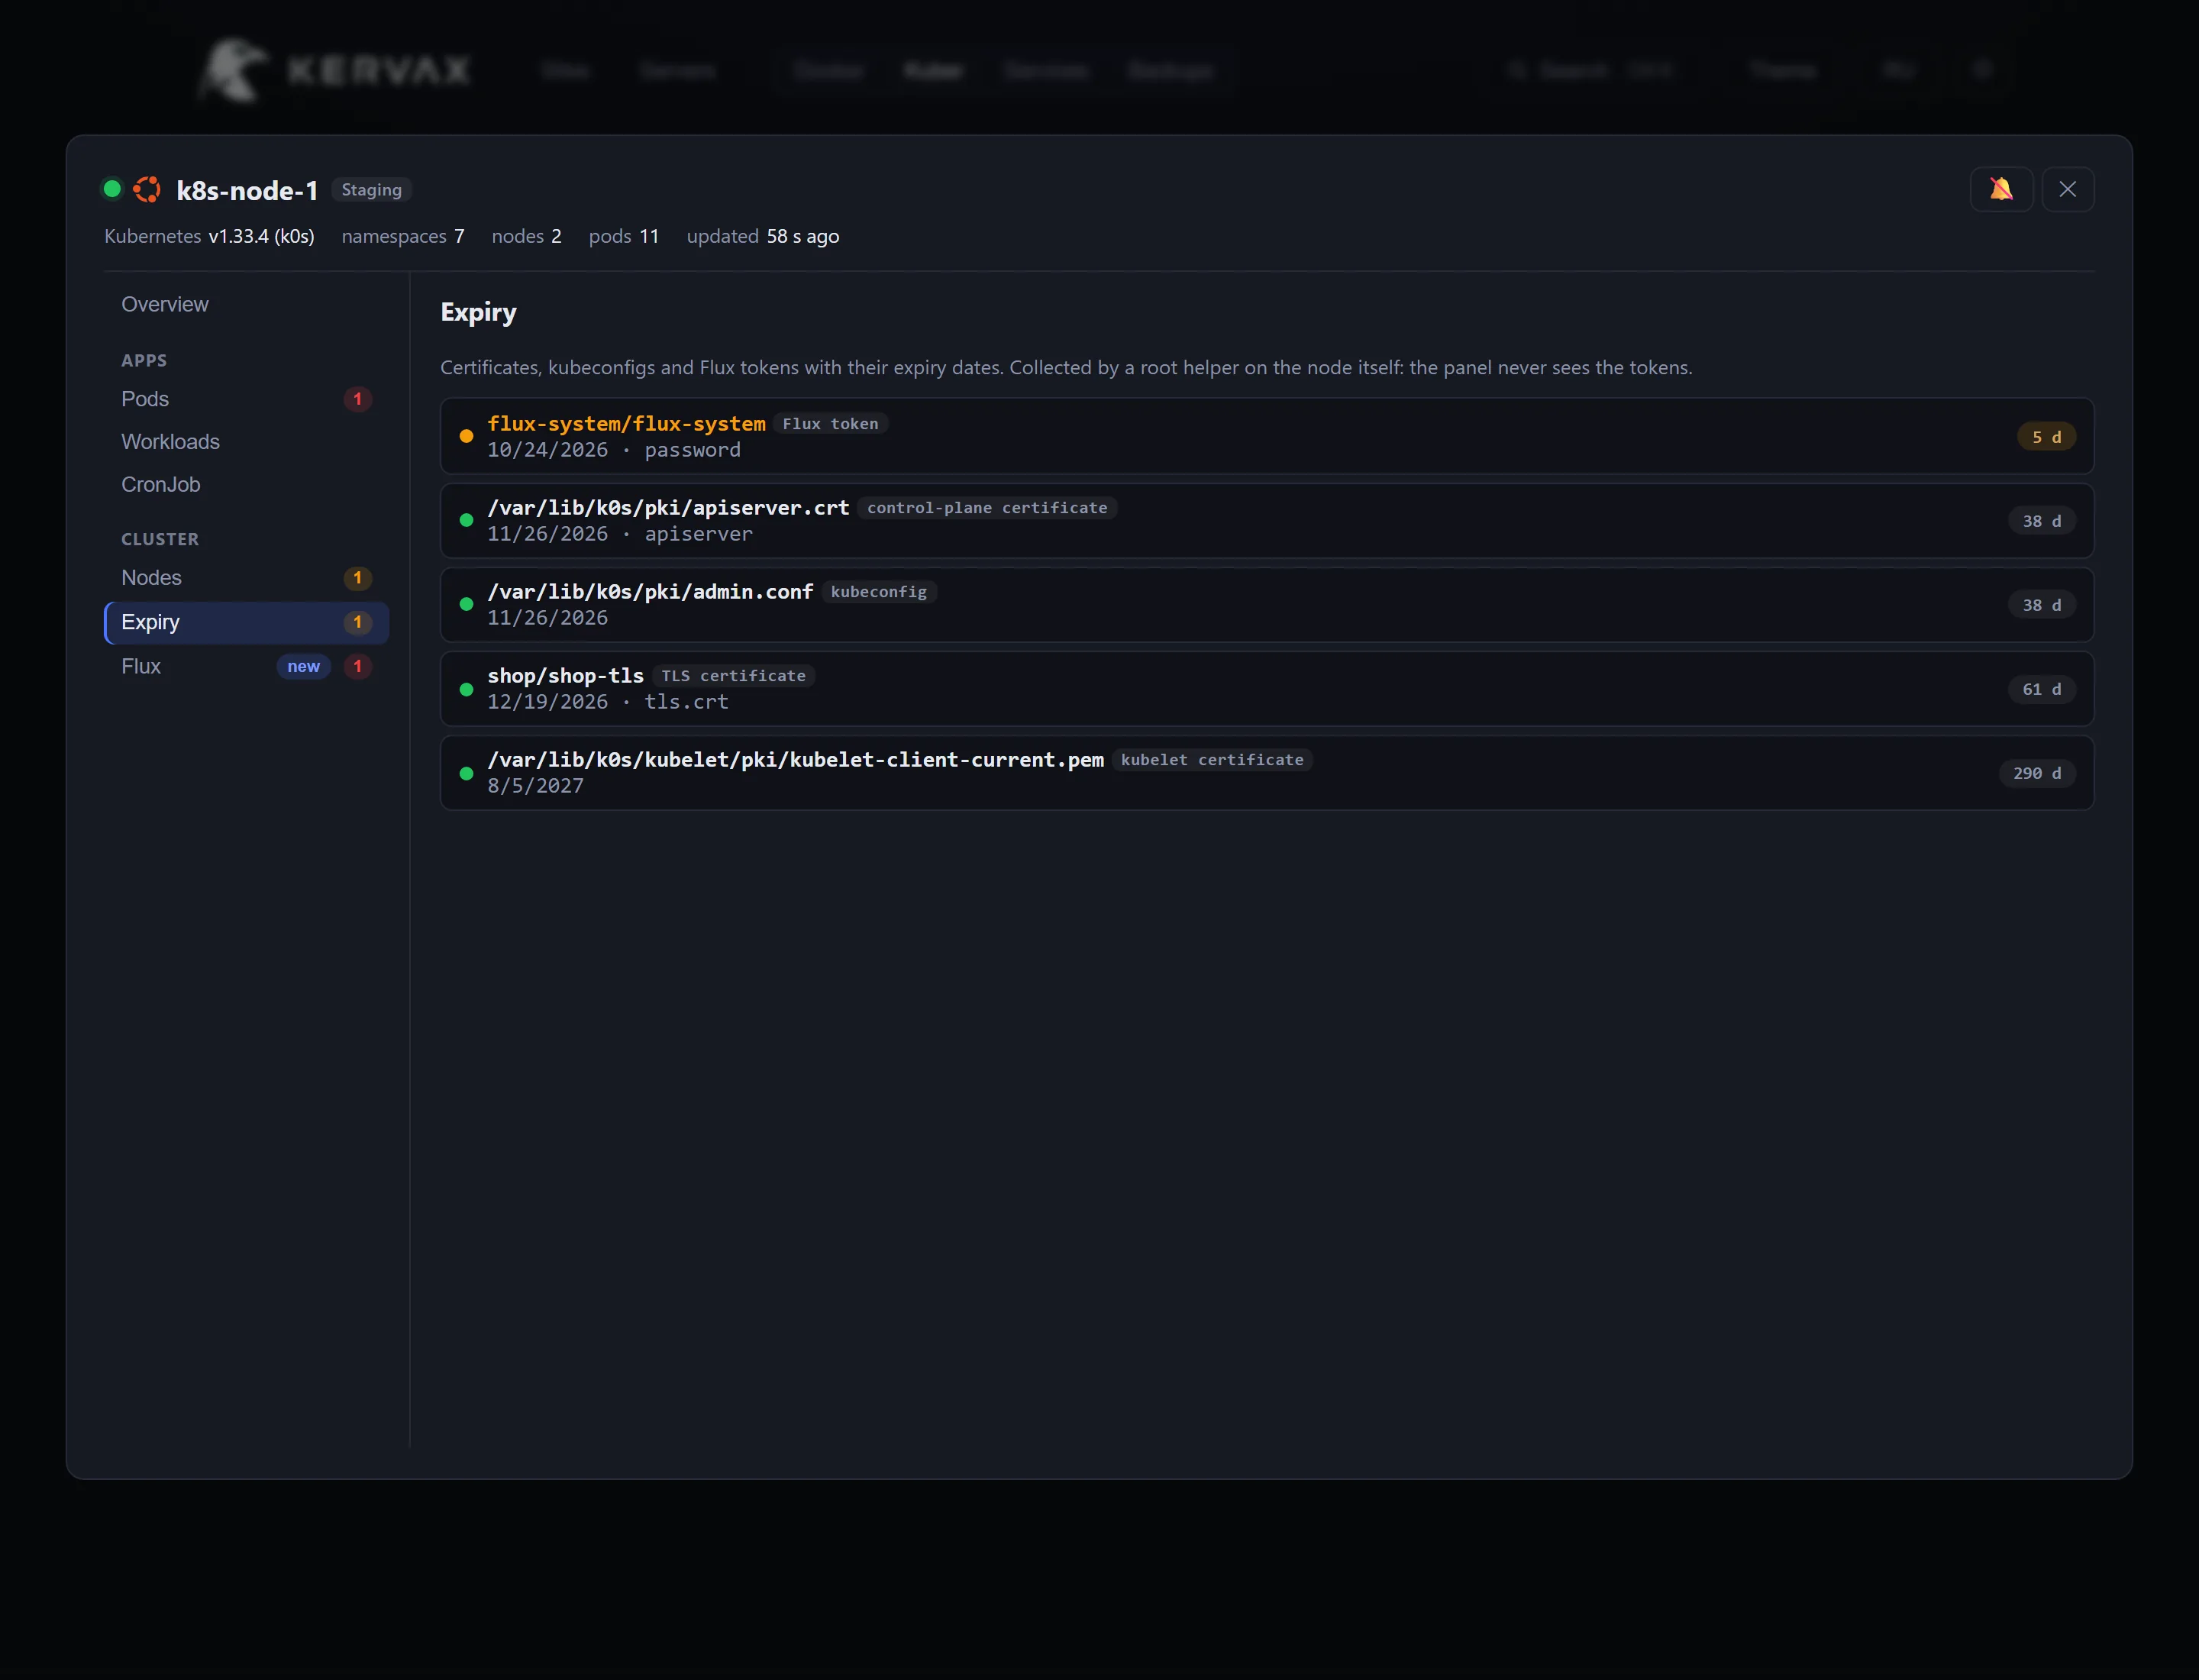
An outdated agent or helper, an unreachable probe location, clock drift on a node, a backup outside its window — all of it collects in "Action needed", together with the command that resolves it.

Out of the box

Ready to use without assembling a stack

A conventional monitoring stack has to be assembled: an exporter per concern, a scrape config, rules, alert routes and a dashboard per entity. Kervax provides the same data already wired together.

TaskKervaxClassic stack
Metrics from a new server one command on the node, data in seconds node_exporter, a scrape target, reload, import a dashboard
Checking a site from outside the monitor address — scheme, certificate and domain are detected blackbox_exporter, a job with relabeling, a rule, a panel
Certificate and domain expiry counted automatically, reminders at 14 / 7 / 1 days a probe and a PromQL rule; for domains, your own exporter
Uptime over 30 days shown on the monitor card a recording rule and a PromQL query
Incidents opened and closed automatically, with history routes, grouping, inhibition and silences in config files
Containers, pods, databases, queues detected by the agent cAdvisor, kube-state-metrics, postgres_exporter, rabbitmq_exporter…
Backup state restic status per node, right in the panel handled separately
Who sees what roles and groups, enforced in the API Grafana orgs and separate access to the store
Dashboards filled in at first sign-in build or import them

Prometheus remains the better choice for application metrics and ad-hoc PromQL queries, and runs alongside without conflict. Kervax covers the infrastructure layer: host, site, certificate, container, backup.

Interface

What it looks like

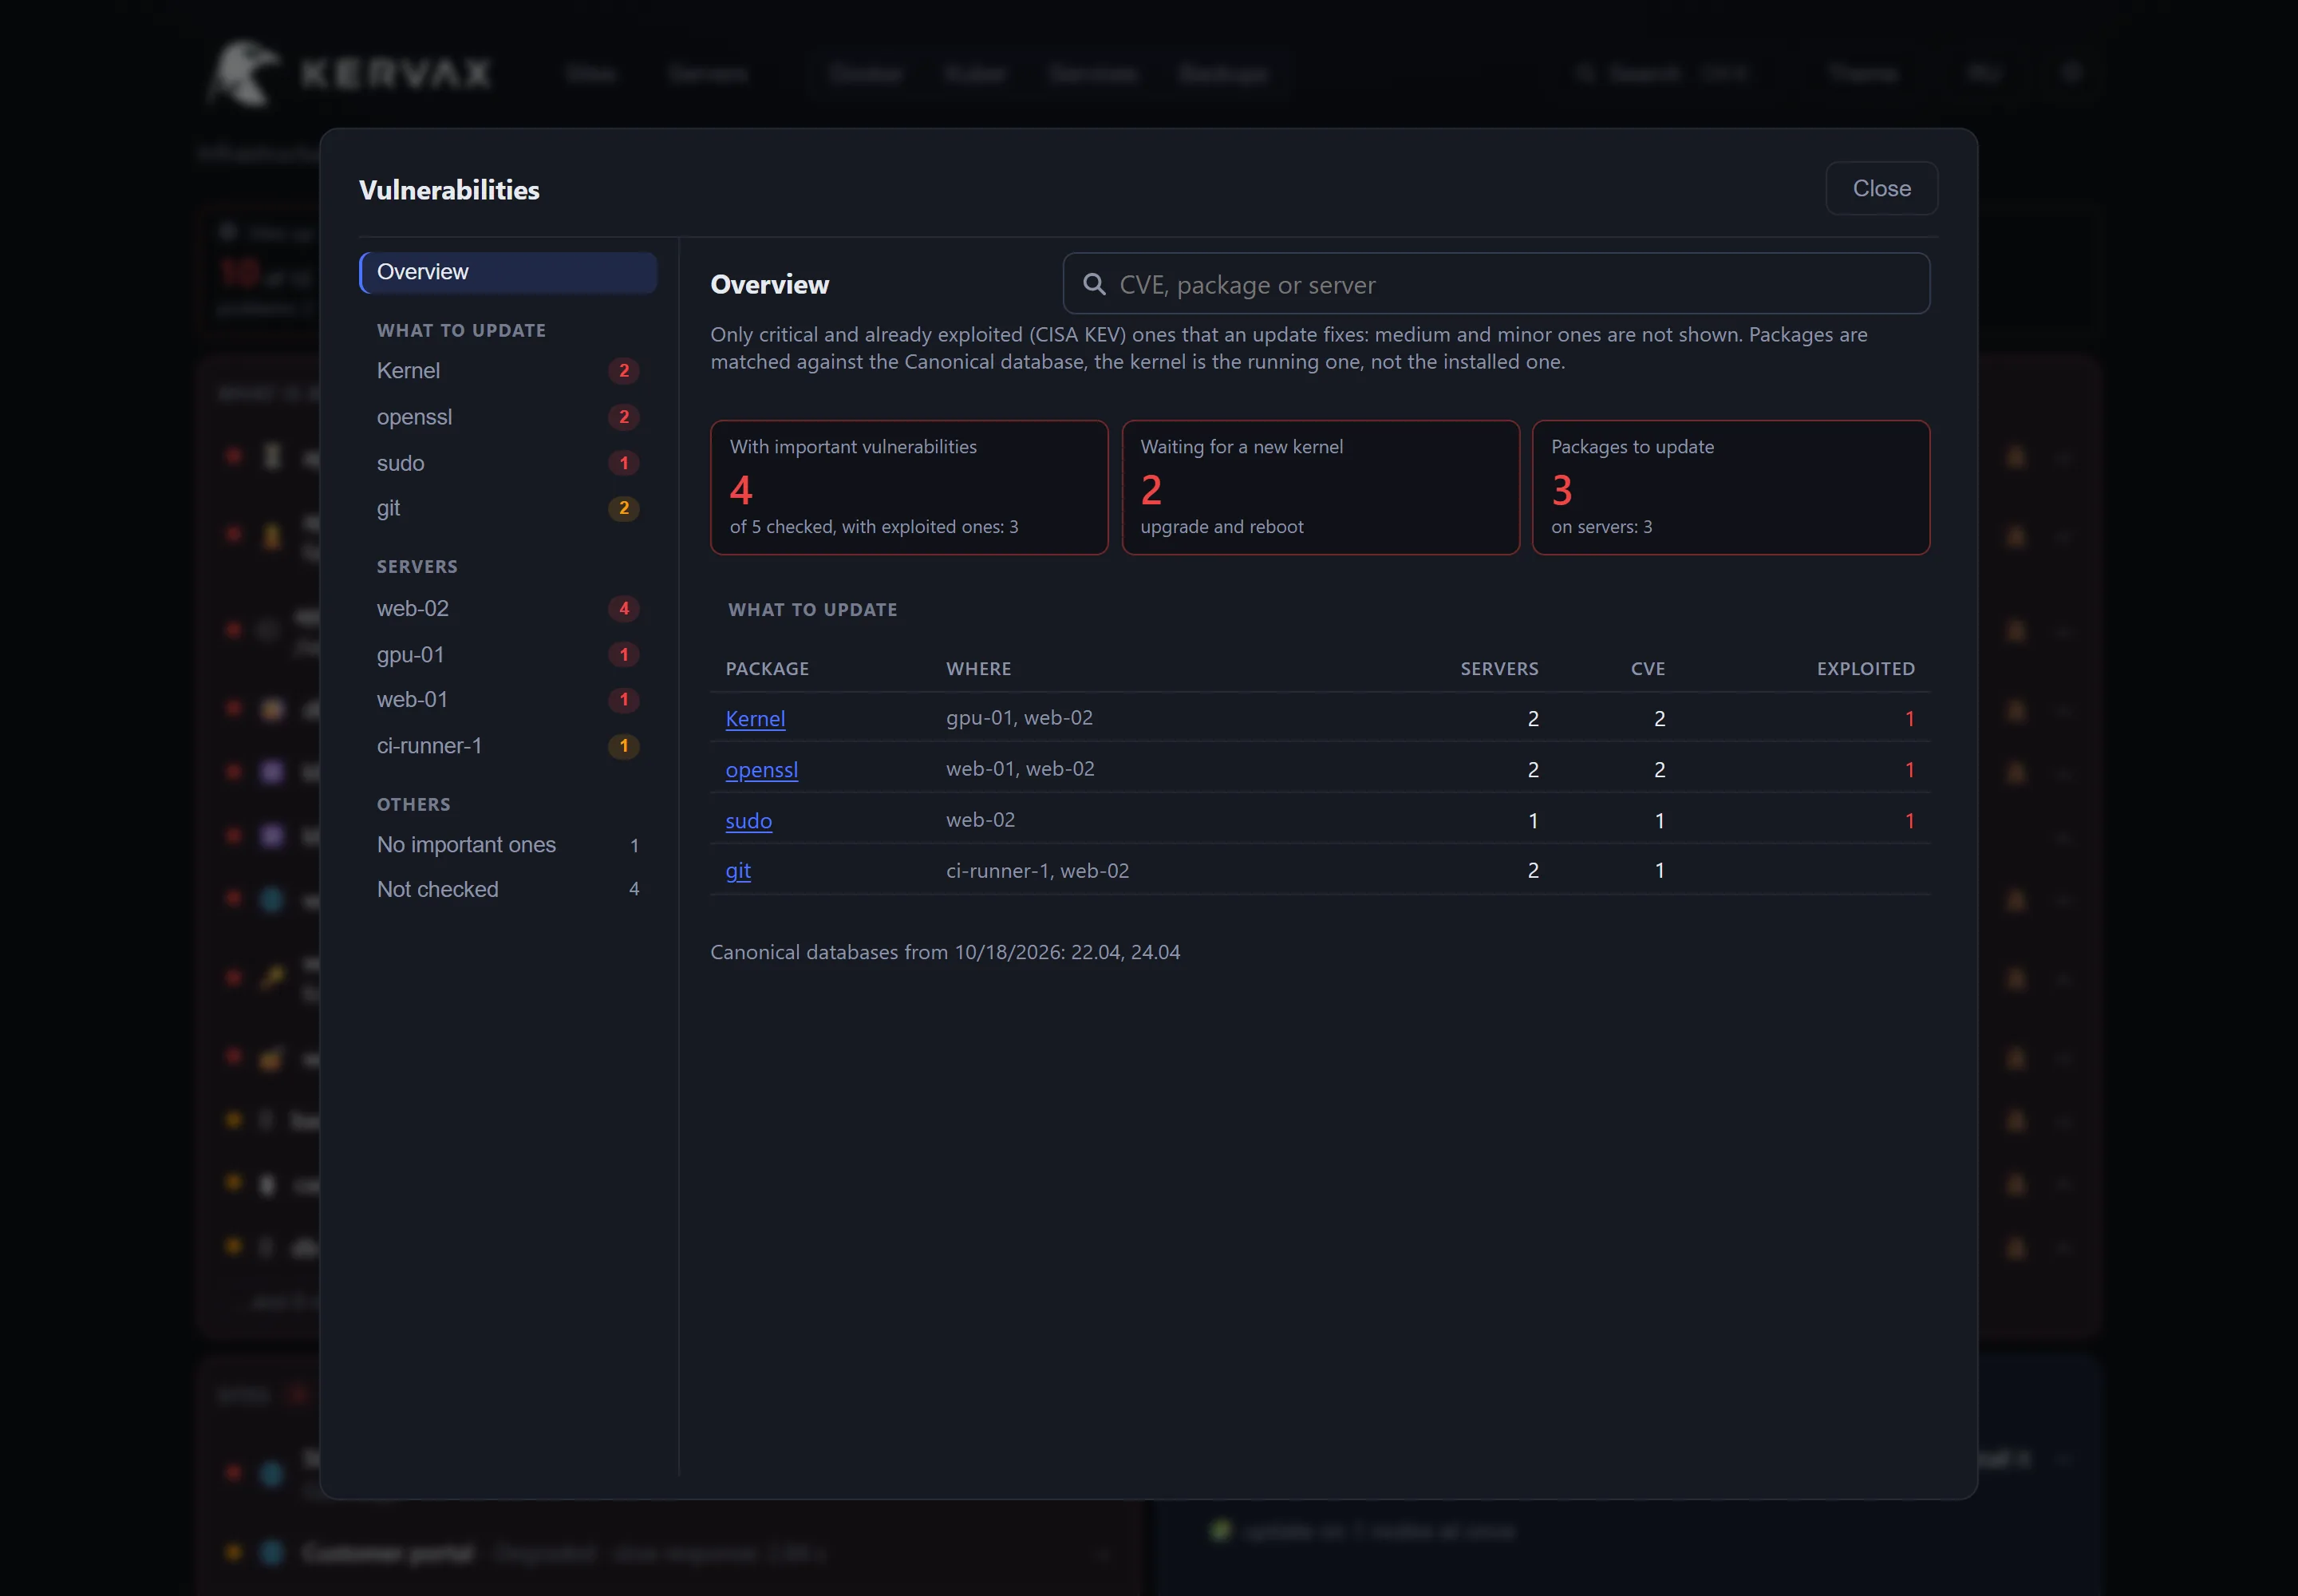
Taken from a running panel on demo data; the interface looks the same after an install.

Install

Install with one command

Runs on a clean Linux server. The command installs Docker, brings up Caddy with a Let's Encrypt certificate, generates the secrets and prints the panel address with the admin password.

$ curl -fsSL https://raw.githubusercontent.com/mihsergeev/Kervax/main/ops/quickstart.sh | sudo sh
Your own domain is optional

Without one the panel comes up on <server-ip>.sslip.io — with a real certificate, on https from the start.

Adding a server

"Add server" produces a ready command. After it runs on the node, metrics appear in the panel within seconds.

Adding a site

An address is enough: scheme, certificate, domain and history are filled in from the first check.

Your own domain, an IP allow-list, an existing nginx in front and a step-by-step walkthrough are covered in the installation guide.

Security

How access is handled